
 By
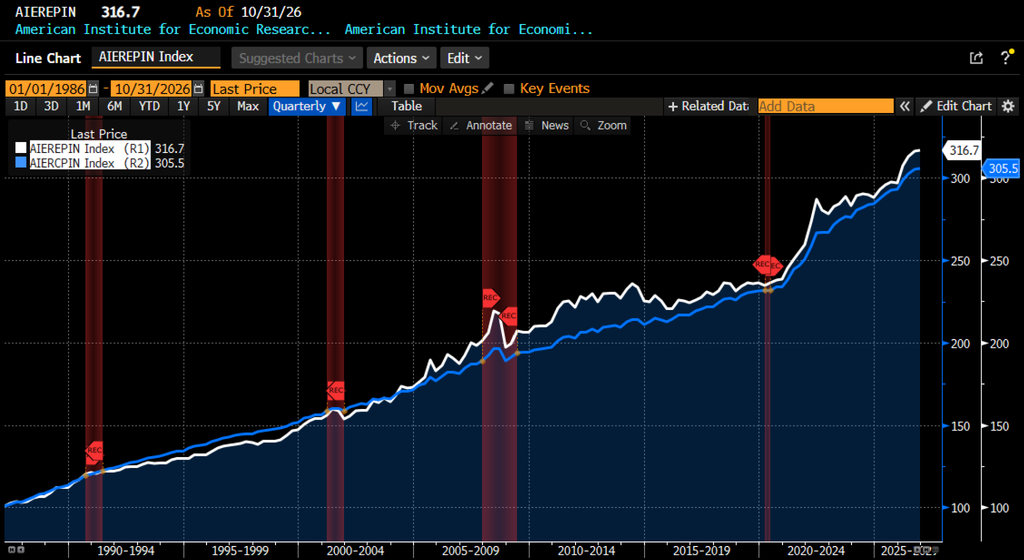
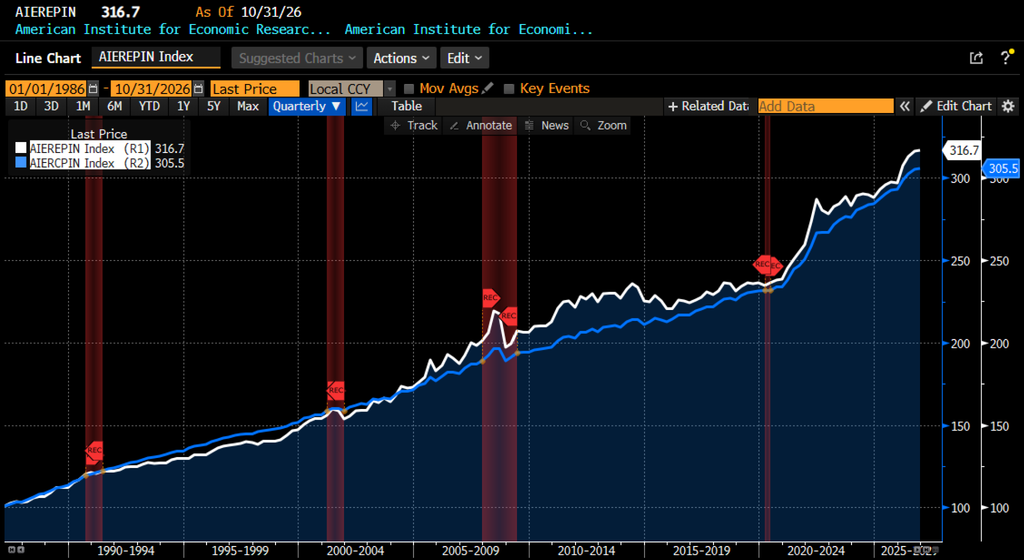
The American Institute for Economic Research’s Everyday Price Index (EPI) increased 0.21 percent in October 2026, reaching 316.7. The gain followed September’s 0.87 percent jump and brought the index 6.64 percent above its December 2025 level. Of the EPI’s 24 components, 16 rose, seven declined, and one was unchanged. The October advance was modest compared with September’s fuel-driven increase, but higher food prices gave it a different composition.
Food purchased both at home and away from home accounted for much of the increase. Grocery prices rose 0.35 percent before seasonal adjustment, while food away from home increased 0.52 percent. Together, the two categories contributed approximately 0.18 percentage points to the EPI’s 0.21 percent rise. Their combined weight — more than 42 percent of the everyday basket — meant that relatively moderate price changes had a substantial effect on the overall index.
The largest individual percentage increase was in intracity transportation, which climbed 6.63 percent. Postage and delivery services followed with a 4.93 percent gain, and recreational reading materials rose 1.61 percent. Gardening and lawn care services registered the largest decline, falling 1.81 percent; motor fuel decreased 0.59 percent, and internet services and electronic information providers fell 0.54 percent. Despite its sharp increase, intracity transportation represents only about 1.15 percent of the EPI basket. Its contribution of roughly 0.08 percentage points was almost offset by the decline in motor fuel, which carries a weight of approximately 13.26 percent.
AIER Everyday Price Index vs. US Consumer Price Index (NSA, 1987 = 100)
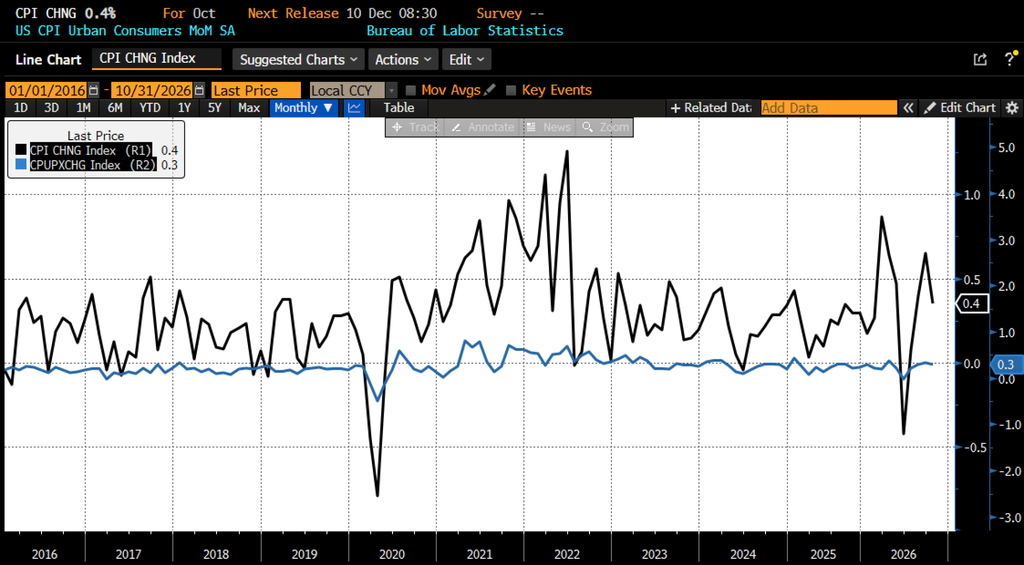
The Bureau of Labor Statistics’ October CPI report showed a slower increase in the broader price index than in September. The seasonally adjusted Consumer Price Index rose 0.4 percent, following a 0.6 percent gain the previous month. Core CPI, which excludes food and energy, increased 0.3 percent for the third consecutive month. Before seasonal adjustment, the all-items CPI rose 0.2 percent to 337.511 on its 1982–84 reference base.
October 2026 US CPI headline and core month-over-month (2016–present)
The EPI and the unadjusted CPI thus rose by similar amounts in October, but their baskets tell different stories. The EPI excludes shelter and other less frequently purchased items, concentrating instead on expenses that households encounter regularly. Food’s weight made it central to the EPI result, while shelter was an important contributor to the broader CPI. The EPI’s component changes are not seasonally adjusted; comparisons with the CPI’s seasonally adjusted figures should be read with that distinction in mind.
Food prices moved back into focus after providing a partial offset to September’s inflation reading. The seasonally adjusted food index increased 0.5 percent in October after being unchanged the previous month. Food at home rose 0.4 percent after a 0.1 percent decline, while food away from home advanced 0.5 percent, compared with 0.2 percent in September. Full-service meals increased 0.7 percent and limited-service meals rose 0.4 percent.
Four of the six major grocery groups increased. The index for other food at home rose 0.7 percent, including a 1.0 percent increase in snacks. Meats, poultry, fish, and eggs advanced 0.5 percent, with beef up 0.9 percent. Fruits and vegetables and dairy products each increased 0.6 percent. Nonalcoholic beverages declined 0.3 percent, while cereals and bakery products were unchanged on a seasonally adjusted basis.
Energy remained a source of upward pressure in the CPI, although the monthly increase was considerably smaller than in September. The seasonally adjusted energy index rose 0.7 percent after a 5.2 percent surge. Gasoline increased 1.0 percent following September’s 9.1 percent gain, and fuel oil rose 2.0 percent. Electricity advanced 0.9 percent, while utility natural gas declined 0.8 percent.
Before seasonal adjustment, however, gasoline prices fell 0.7 percent. That distinction helps explain why motor fuel reduced the EPI even as seasonally adjusted gasoline prices added to the CPI. The EPI’s broader fuels and utilities component was nearly unchanged, declining approximately 0.04 percent. October’s energy result therefore differed markedly from September, when motor fuel accounted for almost all of the EPI’s increase.
Shelter continued to influence the broader CPI. Its index rose 0.3 percent after a 0.4 percent increase in September and accounted for more than 30 percent of the October rise in the all-items index. Owners’ equivalent rent increased 0.3 percent, rent of primary residence advanced 0.2 percent, and lodging away from home rose 0.6 percent. Although shelter is excluded from the EPI, it remains an important household expense and a major component of the CPI.
Elsewhere, price changes across goods and services were mixed. Recreation increased 0.8 percent, motor vehicle insurance rose 0.7 percent, and education advanced 0.3 percent. Medical care also increased 0.3 percent, with hospital services up 0.8 percent and physicians’ services up 0.4 percent. Prescription drugs rose 0.3 percent after declining in September. Used cars and trucks moved in the opposite direction, falling 1.2 percent, while communication prices declined 0.1 percent.
The October report contains an important limitation for annual comparisons. Because a lapse in appropriations prevented BLS from collecting most October 2025 CPI data, the agency cannot publish October 2026 12-month changes for many series, including the all-items and core indexes.
Some annual comparisons remain available. Gasoline prices were 37.4 percent higher than in October 2025, despite their unadjusted monthly decline. New vehicle prices were up 0.7 percent over the same period, while used cars and trucks were down 3.3 percent. Those figures describe the categories for which BLS had comparable observations; they cannot establish an overall October inflation rate.
October’s CPI was hot enough to make a December hike likely, but the composition points to several distinct sources of pressure. Used-car prices fell sharply, inflation in AI-exposed electronics eased from earlier peaks, and travel prices softened. The clearest pressure on goods came from appliances, furniture, and tools, where higher freight and metals costs appear to be reaching consumers. Recreation services also contributed to the upside surprise, and the persistence of owners’ equivalent rent makes it harder to dismiss September’s shelter reading as a one-off. The breadth measures capture the tension. Fewer categories were running above 3 percent over the past year, while more crossed that threshold over the past six months. That recent widening gives the Fed reason to worry even as some of the most visible sources of inflation cool.
The December question is how much to hike, and the January question is whether the Fed can afford to pause. Implied rate markets still favor 25-basis-point lift in December and another quarter-point increase in January. Yet Fed governor Christopher Waller raised the possibility of a 50-basis-point hike next month, while Dallas Fed President Lorie Logan made the case for moving more quickly through successive quarter-point rate hikes. Before the December meeting, the Fed will see another jobs report and October’s PCE release. Bloomberg Economics expects core PCE to accelerate to 0.38 percent on the month and 3.3 percent over the year. If PCE confirms that acceleration and hiring stays firm, the case for a larger December move or back-to-back hikes strengthens. If hiring softens or the jump in yields materially tightens financial conditions, a quarter-point move would give the Fed more room to assess how much of October’s pressure carries into the winter.
To maintain consistency in the preparation and presentation of the AIER Everyday Price Index, portions of the report are completed with the assistance of artificial intelligence. All analysis, conclusions, and editorial decisions are reviewed by AIER research staff.