
 By
By 
AGNC Investment stock has sold off sharply in the past few weeks, and this retreat may continue after it formed the highly bearish double-top pattern. It has slipped for eight consecutive weeks, reaching its lowest level since September 29. It remains down by 23.4% from its highest point this year, bringing its yield to 17%.
AGNC stock is crashing as mortgage rates jump
AGNC Investment is a top company in the mortgage industry, where it provides private capital to the housing market by investing in Agency residential mortgage-backed securities on a leveraged basis.
Its mortgages are backed by Fannie Mae, Freddie Mac, and Ginnie Mae. In its last results, management said that its portfolio is worth more than $97.2 billion. It also ended the quarter with a 7.4x leverage ratio.
The stock has been under pressure in the past few months as investors have focused on rising interest and mortgage rates. US short and long-term interest rates have continued rising in the past few months, with the 10-year hitting 5.33% and the 30-year rising to 5.71%.
US mortgage rateshave continued rising, with the average figure to the highest level in over three years. This surge is having a major impact on the business because agency MBS are fixed-rate bonds. As such, when Treasury yields and mortgage rates rise, their prices fall.
AGNC uses hedges to mitigate these risks with swaps, Treasury futures, and other instruments. The challenge, however, is that hedges cover duration, and not the full convexity profile, while mortgage spreads often widen in rate shocks. Also, its funding costs tend to rise in these conditions.
The most recent results showed that AGNC’s net interest income rose to $305 million in the second quarter, with its total income rising to over $654 million.
AGNC has now become one of the top yielders in the US, with a dividend yield of nearly 17%. In contrast, the S&P 500 Index is yielding less than 2%. This yield should offset the falling stock price.
However, the reality is that the stock has continued to underperform other companies. Its total return this year stands at minus 12.67%, compared to the S&P 500 Index’s 14.90% and Realty Income’sminus 1.55%.
AGNC Investment stock price analysis
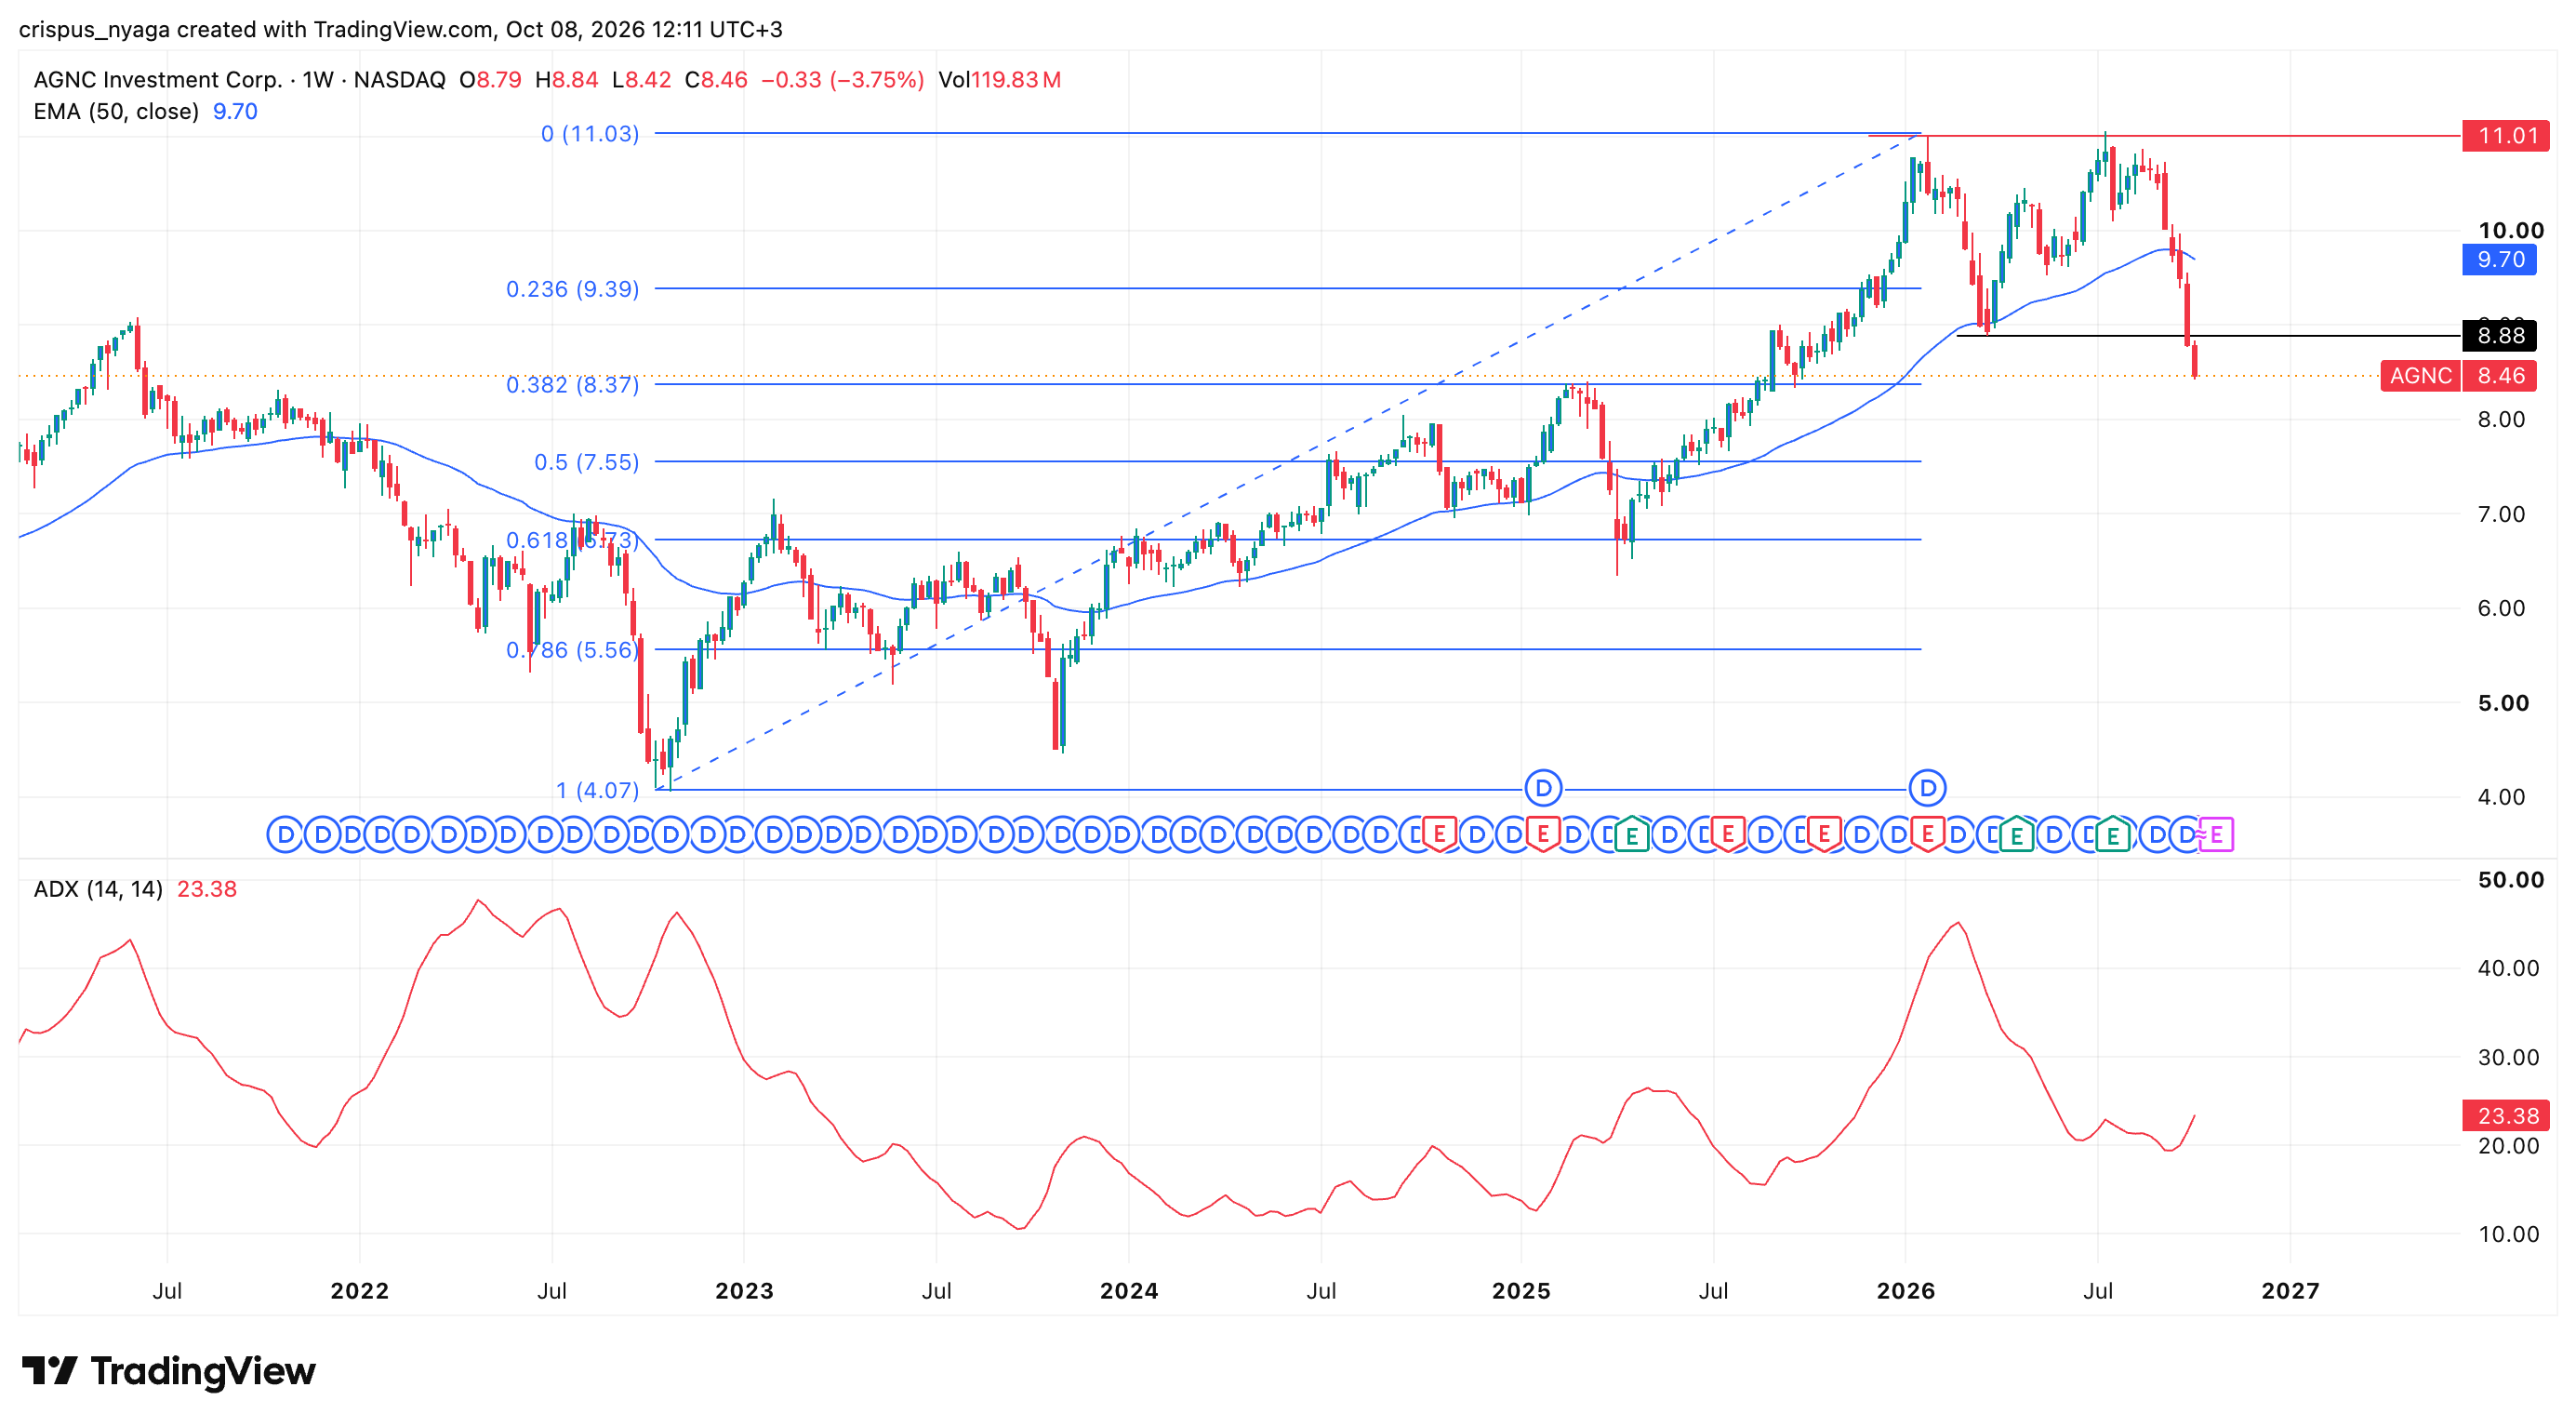
AGNC Investment stock chart | Source: TradingView
The weekly chart shows that the AGNC share price has slumped in the past few weeks. This retreat happened after forming a double-top pattern at $11 and a neckline at $8.88. A double-top is one of the most common bearish reversal signs in technical analysis.
The stock has now dropped below the 23.6% Fibonacci retracement level of $9.40. It has also slumped below the 50-week Exponential Moving Average (EMA).
At the same time, the Average Directional Index (ADX) has reversed and started rising to the current 23.8. A rising ADX is a sign that the trend is continuing.
Therefore, the stock will likely continue falling, potentially to the 50% Fibonacci retracement level of $7.55. A move above the resistance level of $8.88 will invalidate the bearish outlook.
The post AGNC stock has a dividend yield of 17%: is it a buy as a risky pattern forms? appeared first on Invezz