
 By
By Unemployment Insurance in the Wake of 2020 and the Path to Reform
Executive Summary
The following paper examines unemployment insurance (UI) trust fund solvency before, during, and after the COVID-19 economic downturn of 2020. This paper examined UI trust fund solvency levels for all 50 states and the District of Columbia from 2014 through 2025. The central finding is that state UI systems did not fail or recover uniformly. States entered 2020 with different reserve positions, and those starting conditions shaped their ability to absorb the shock. States that exited federal pandemic UI programs earlier and more fully generally experienced stronger trust fund outcomes, while partial withdrawal, borrowing, and administrative weakness complicated recovery. The evidence is descriptive rather than causal, but it suggests that UI solvency depends on institutional design, fiscal discipline, and administrative execution.
Key Points
This paper finds the following:
- State unemployment insurance trust funds entered 2020 with different levels of preparedness. Those with the strongest solvency were better positioned to absorb the 2020 shock and recover afterward.
- The COVID-19 economic downturn produced a sharp solvency shock across the board. Some states were hit harder and took longer to recover, depending on their reserve levels, benefit payouts, and financing decisions.
- States that exited the federal pandemic unemployment programs earlier in 2021 generally maintained stronger trust funds and recovered faster than states that remained in the program until expiration.
- Timing mattered. States that exited earlier tended to see better outcomes, suggesting that prolonged participation may have weakened recovery.
- Arkansas, Indiana, Maryland, and Oklahoma attempted to exit the program early but were only partially successful because of legal or administrative obstacles. These cases suggest “partial withdrawal” did not produce the same results as full withdrawal.
- Debt and improper payments compounded existing problems. Although improper payments were not the primary drivers of solvency deterioration, states with higher improper payment rates tended to recover more slowly and benefited less from policy changes.
- The path forward is to replace the existing framework with personal savings-based alternatives. Personal unemployment insurance savings accounts (PISAs) may improve on the status quo, but universal savings accounts (USAs) offer a broader and potentially stronger alternative.
How a Temporary Crisis Exposed Permanent Weaknesses
The 2026 Department of Labor report on State Unemployment Insurance Trust Fund Solvency notes that only eighteen states meet the minimum solvency standard going into a recession.[1] Conversely, in February 2020, 31 states had solvency levels “greater than or at the recommended minimum solvency standard.”[2]
Solvency reflects a state’s ability to pay full unemployment benefits — typically 30 percent to 50 percent of lost wages for up to 26 consecutive weeks — relative to total wages within the state.[3] The current structure is especially vulnerable to the next economic downturn. This paper explores why state UI trust funds experienced such different outcomes after the same national shock. The analysis finds that the interaction between the 2020 shock, pre-2020 trust fund solvency, state policy choices, and administrative capacities all contributed to the variation in solvency outcomes. It also examines how a federal-state program designed for stabilization can weaken fiscal discipline when costs are pooled across governments or pushed onto future taxpayers and employers.
With the federal government facing growing fiscal pressure from rising public debt and structural deficits, the unemployment insurance program cannot rely indefinitely on emergency cash injections to compensate for underlying program weaknesses. While technical fixes aimed at improving program integrity can offer slight improvements, fully replacing UI with universal savings accounts (USAs) can help remove the structural problems that produced the current situation.
The first section briefly outlines unemployment insurance (UI) and where UI policy currently stands. The second section examines UI trust fund solvency before and after the 2020 downturn. The third section explores ways to reduce stress on UI trust funds, including improving program integrity and expanding state flexibility. It also discusses replacing the existing UI system with universal savings accounts. The fourth section concludes. The appendix includes a glossary of key terms, describes the data, and fully discusses model equations and empirical results.
Section 1: What is Unemployment Insurance and How Does it Work?
To understand unemployment insurance, it is important to understand the concept of a reservation price, specifically a reservation wage. A reservation wage is the lowest wage at which someone will accept a job. When someone searches for a job, they look for a job that matches that reservation wage or higher. This comes at the cost of the foregone income you give up by not taking the first job available.
In practice, unemployment insurance (UI) is a joint state-federal program that provides cash benefits to eligible workers who lose their jobs. While states follow uniform federal law, each state administers its own UI program. These programs are funded with taxes on employers based on the wages paid to employees. The taxes are then transferred into trust fund accounts maintained at the US Treasury.[4] There are no federal requirements specifying how much money states must maintain in their trust funds. Instead, states operate on a forward-funding basis, building up reserves during periods of economic growth in anticipation of higher benefit payouts during recessionary periods.[5] The Unemployment Insurance Trust Fund (UTF) is overseen by the Treasury and contains 59 different accounts: 53 state accounts — representing all 50 states, the District of Columbia, Puerto Rico, and the US Virgin Islands — along with four interrelated federal accounts and two accounts associated with the Railroad Retirement Board.[6] For states, these accounts act similarly to a checking account, but understanding how taxpayer dollars flow to these accounts can be complicated.
The modern UI system was created in 1935 through the Social Security Act. At the time, most unemployment insurance options were voluntarily created by employers or established in trade agreements.[7] One exception was the state of Wisconsin, which was the only state to establish an unemployment insurance fund managed by the state government.[8] The creation of the joint federal-state program ushered in a federal unemployment payroll tax that was paired with a tax offset for employers. This structure allowed the federal government to create the financing framework while leaving states substantial discretion over benefit levels, eligibility rules, and program administration. Additionally, different sectors of the economy were given “experience ratings,” which tied the amount of payroll taxes to firms’ “layoff behavior.” Employers who maintain a “stable work force” are assigned favorable tax rates compared with the rates of other employers.[9]
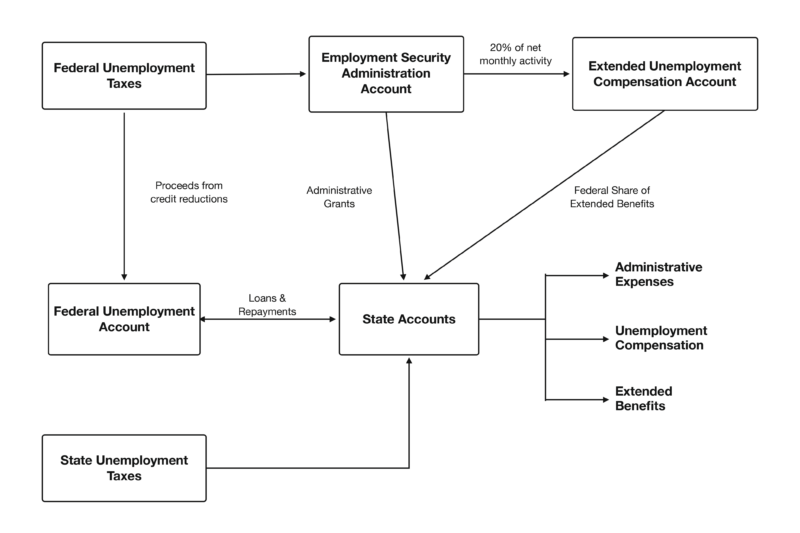
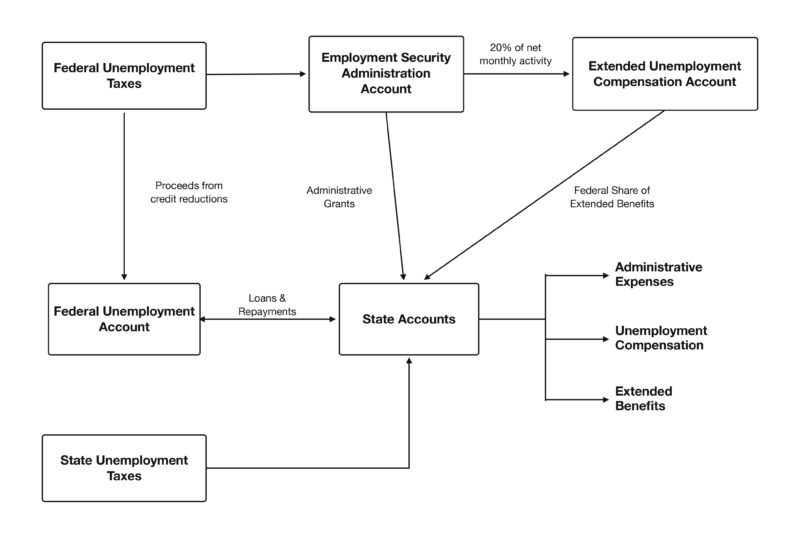
The creation of the mandatory, tax-financed system reshaped the landscape of private and voluntary unemployment insurance arrangements. The program crowded out private unemployment insurance plans using mandatory payroll taxes (coming at the cost of higher employee compensation, a private unemployment insurance plan, or a myriad of other uses) as well as the broader risk-pooling capacity of the public system, backstopped by federal taxpayers. [10] Over time, the program grew in size and scope, introducing new layers of financial and administrative complexity. Coverage broadened from a limited segment of the workforce to include most wage and salary workers. Bene-fit structures converged toward a standard of replacing about half of prior wages for up to 26 weeks. The broader federal program evolved to include mechanisms for extending and increasing benefits during periods of high unemployment. Beginning with temporary programs in the postwar period and culminating in the establishment of a permanent extended benefits framework in 1970, unemployment insurance increasingly incorporated features designed to respond automatically to cyclical downturns.[11] These additions transformed the program from a narrowly defined insurance mechanism into a central component of the federal government’s countercyclical policy toolkit.[12] Figure 1 (below), reproduced from the Bipartisan Policy Center, illustrates how money flows through the UTF.[13]
Figure 1: How Taxpayer Dollars Flow Through the Unemployment Insurance Trust Fund
Sources: Sprick, Emerson. “How Is the Unemployment Insurance Program Financed?” Bipartisan Policy Center. 15 Mar 2022; US Department of Labor.
In Figure 1, previous page, the three accounts (seen in bold) serve the following purposes:
- Employment Security Administration Account (ESAA): This is the first destination of most federal unemployment tax revenue. The federal government treats this like a checking account, directing tax revenues in one of three ways:
- Funding federal administrative costs of the UI program
- Funding state administrative costs by dividing the funds earmarked for administrative purposes into state accounts.
- Funding Extended Unemployment Compensation Accounts.
- Extended Unemployment Compensation Account (EUCA): This finances the federal government’s share of Extended Benefits costs. The Treasury is statutorily required to transfer 20 percent of ESAA’s net monthly balance (revenue minus distributions) into the EUCA each month.
- Federal Unemployment Account (FUA): This provides loans to states that do not have sufficient funds to cover UI benefits. This is funded by loan repayments from state tax dollars and revenue from higher federal unemployment taxes placed on employers when the state has outstanding loans.
- Federal Employees Compensation Account (FECA): This account reimburses states for UI benefits paid to former federal employees. Each federal agency transfers money to FECA to cover UI benefits for its workers.[14]
The evolution of the unemployment insurance system introduced new layers of complexity into its financing and governance. While the original design emphasized the accumulation of reserves during periods of economic expansion, repeated downturns exposed weaknesses in state-level programs. In response, the federal government expanded its role through mechanisms that facilitate borrowing, redistributed funds across states, and support extended-benefit payments. Federal borrowing and cross-state financing weakened the link between contributions and payouts, reducing cost discipline.
Public agencies operating under conditions of imperfect oversight and indirect cost allocation tend to expand beyond strictly efficient levels, particularly when their budgets are financed through pooled or opaque revenue sources.[15] The unemployment insurance system’s administrative financing and shared fiscal structure exhibit these characteristics, as costs are spread broadly while decision-making authority remains fragmented.
At the same time, the financing mechanisms embedded in the unemployment insurance system create opportunities for intertemporal cost shifting. Federal lending to state trust funds and the use of deferred tax adjustments allow policymakers to deliver benefits during downturns without imposing immediate, visible costs on taxpayers or employers. This dynamic aligns with James Buchanan’s analysis of public finance, which emphasizes how political actors face incentives to shift the burden of current expenditures into the future, thereby reducing present resistance to spending increases.[16] In the context of unemployment insurance, borrowing and delayed financing mechanisms soften budget constraints and enable benefit expansion during periods of economic stress, while postponing the fiscal adjustments required to restore solvency.
These institutional features are reinforced by increasing reliance on automatic stabilizers within the unemployment insurance system. The development of extended benefit programs and other countercyclical mechanisms allows expenditures to rise without the need for new legislative action. While such features can enhance macroeconomic stabilization, they also reduce the frequency with which policymakers must explicitly weigh the tradeoffs between program generosity and financing. More broadly, the system illustrates a central insight of public choice theory: policy outcomes are shaped not only by stated objectives, but by the incentive structures embedded in institutions.[17] In this case, the combination of decentralized administration, pooled financing, and intertemporal fiscal mechanisms produces a system that is capable of responding flexibly to economic shocks, but one in which the link between costs and benefits is obscured.
It’s also important to note that an unemployed worker is not currently employed but is seeking employment. Those who do not have a job and are not looking for one are counted as not in the labor force.[18] Workers who are not in the labor force are not eligible for UI benefits.
A worker becomes qualified for UI payments if.[19]:
- The worker is terminated from a job without cause.
- The worker meets work and wage requirements, such as the state’s requirements for wages earned or time worked during a calendar period.
- The worker meets any additional state requirements.
To maintain eligibility, workers must file weekly claims, report earnings, job offers and enroll with the State Employment Service to assist the worker in finding employment.[20] These UI benefits are designed to supplement income while workers are searching for a job. By supplementing income, workers can spend more time searching for a job that provides their desired wage. Unfortunately, this system is susceptible to fraud and corruption. As outlined in the introduction, the changes made to UI benefits during the course of the pandemic made unemployment fraud much easier and more widespread.
Figure 2 (below) groups states by two measures: trust fund solvency (2026) and estimated unemployment insurance tax burden (2025) using the latest data available at the time of writing this paper.[21],[22] Solvency is measured by the 2026 Average High Cost Multiple (AHCM), with states at or above 1.0 classified as high solvency. Tax burden is measured by the 2025 estimated employer contribution rate as a percentage of taxable wages, with states at or above the national average of 1.74 percent classified as high tax.
Figure 2: Taxation to Solvency Ratios
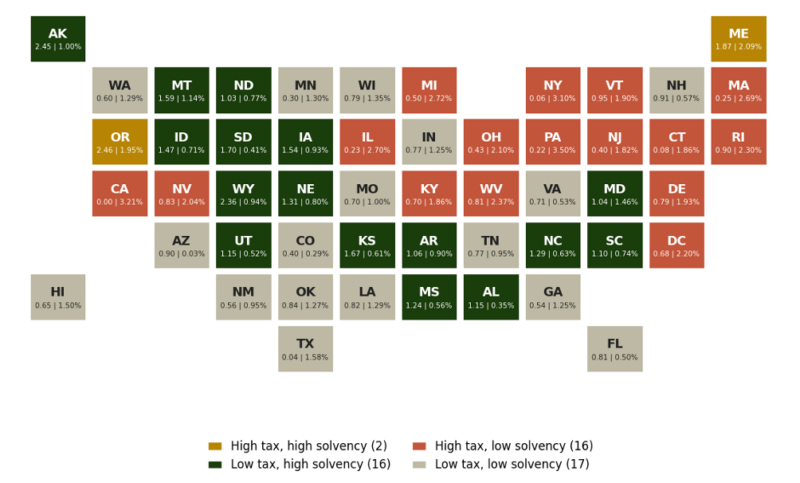
Notes: Each tile reports state abbreviation, 2026 AHCM, and 2025 estimated employer contribution rate as percent of taxable wages. High solvency = 2026 AHCM ≥ 1.0. Low solvency = 2026 AHCM < 1.0. High tax = 2025 estimated employer contribution rate (% of taxable wages) at or above the U.S. average of 1.74. Low tax = below 1.74. Includes DC; excludes Puerto Rico and the Virgin Islands. Image designed in Python with assistance from ChatGPT.
Sources: U.S. Department of Labor, State Unemployment Insurance Trust Fund Solvency Report 2026; U.S. Department of Labor, Estimated Employer Contribution Rates, Calendar Year 2025.
The most favorable category is low tax, high solvency, shown in dark green. Sixteen states fall into this group: Alabama, Alaska, Arkansas, Idaho, Iowa, Kansas, Maryland, Mississippi, Montana, Nebraska, North Carolina, North Dakota, South Carolina, South Dakota, Utah, and Wyoming. These states combine relatively stronger trust fund positions with below-average UI tax rates.
Only Maine and Oregon fall into the high tax, high solvency category. Sixteen states fall into the high tax, low solvency group, including California, Illinois, New York, Pennsylvania, and several northeastern states. These states face both below-benchmark solvency and above-average tax rates.
The low tax, low solvency category contains seventeen states, including Arizona, Colorado, Florida, Georgia, Indiana, Texas, Virginia, Washington, and Wisconsin. These states have below-average tax rates but a trust fund solvency rate below the 1.0 AHCM benchmark.
The next section explains the patterns shown in Figure 2 (previous page) by examining pre-2020 reserves, the 2020 economic downturn, policy choices, borrowing, and administrative capacity.
Section 2: UI Trust Fund Solvency Before and After 2020
This section presents the paper’s main findings in plain language. It explains how state unemployment insurance trust fund solvency changed before, during, and after the 2020 economic downturn, with particular attention to pre-pandemic solvency levels, benefit costs, borrowing, early withdrawal from federal pandemic UI programs, partial-withdrawal cases, and program integrity. The purpose of this section is to make the results accessible to readers who want to understand the broader patterns without engaging the full econometric analysis. Technical readers can find the model specifications, variable definitions, robustness checks, and complete regression results in the appendix.
2.1 Summary of Findings: What Explains Differences Across States?
The evidence points to several factors that help explain why state UI trust funds recovered differently after the pandemic shock. The most consistent finding is that states with stronger pre-pandemic solvency remained in better condition after the shock. That finding is consistent with the forward-funding logic of the UI system: reserves accumulated during periods of economic expansion before claims surge.[23] Policy timing also matters, but the evidence should be stated carefully. Earlier and more complete withdrawal from federal pandemic UI programs is associated with healthier post-pandemic trust fund outcomes. The relationship is consistent across specifications, but it is descriptive rather than causal. States did not withdraw at random.
Implementation matters as well. Full withdrawal and partial withdrawal are not interchangeable. Arkansas, Indiana, Maryland, and Oklahoma attempted early withdrawal but faced legal, administrative, or implementation complications. Their results differ from the full-withdrawal states, reinforcing the importance of distinguishing announcement from sustained policy execution.[24]
Borrowing completes the fiscal story. States with greater borrowing exposure generally exhibited weaker later solvency, although borrowing itself was largely a response to trust fund stress. Program integrity also belongs in the narrative because pandemic UI created major administrative and fraud-control challenges. However, the regression evidence on improper payments is less consistent than the evidence on initial solvency conditions, withdrawal timing, implementation, and borrowing.
The central findings are institutional. Post-2020 UI trust fund recovery was associated with how prepared states were before the shock, how long they remained in temporary federal programs, the extent to which withdrawal policies were fully implemented, reliance on borrowing, and how effectively their systems were administered under stress.
2.2 Starting Conditions: The Pre-2020 Landscape
The UI system illustrates institutional path dependence in a limited sense. Policy rules and fiscal choices made before 2020 shaped the feasible options available afterward, while still leaving room for adaptation and reform.[25] States entered 2020 with very different UI trust fund positions. Some had built sizable reserves relative to their taxable wage bases. Others had allowed their systems to remain thinly capitalized despite years of economic expansion. Those differences reflected prior policy choices, including tax schedules, benefit rules, taxable wage bases, and the political willingness to accumulate reserves when unemployment was low. Federal law does not require every state to maintain a specific trust fund balance, but the solvency framework assumes states will build reserves during stronger labor-market periods so they can finance benefits when unemployment rises.[26]
Once the pandemic shock arrived, these differences became consequential. States with stronger pre-pandemic trust funds were better positioned to pay benefits without quickly resorting to borrowing. Their solvency measures declined, but the decline was less severe, they tended to recover more quickly after the initial shock passed.
Figure 3: State AHCM Before and After the Pandemic: 2019 vs. 2023
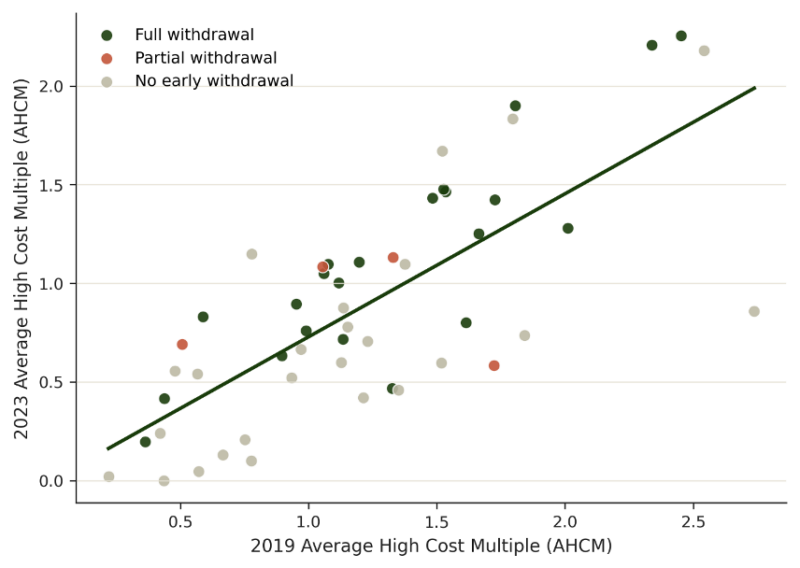
Notes: The withdrawal status is discussed in Section 2.6. Figure includes DC; excludes Puerto Rico and the Virgin Islands. Image designed in Python with assistance from ChatGPT.
Sources: U.S. Department of Labor, State Unemployment Insurance Trust Fund Solvency Report 2026
States with weaker starting positions faced the opposite problem. They had to finance elevated claims from a smaller reserve base. In many cases, this meant deeper drawdowns, greater reliance on external financing, and a more difficult recovery. Rebuilding reserves after a downturn is harder than building them beforehand, especially when states must also manage debt obligations and political pressure to avoid tax increases. Figure 3 (above) illustrates these patterns.
This pattern appears across both solvency measures used in the analysis. The estimated magnitude differs across specifications, but the direction is stable: stronger initial solvency is associated with stronger post-pandemic solvency outcomes.
The findings of this paper are consistent with the institutional logic described above. The 2019 solvency controls are positive and statistically significant across the baseline models, indicating strong persistence in trust fund condition. In the initial conditions specifications, both the 2019 AHCM variable and the 2019 reserve ratio are positive and statistically significant in their respective models. The high explanatory power in these models is consistent with strong path dependence in state trust fund condition.[27] In plain terms, states that were stronger before the pandemic generally remained stronger afterward. They still experienced the shock, but they had more fiscal room to absorb it.
2.3 How Trust Fund Health Is Measured
This analysis uses two complementary measures of UI trust fund health: the Average High Cost Multiple (AHCM) and the reserve ratio.
The Average High Cost Multiple measures preparedness for economic stress. It compares current reserves to a state’s historically high benefit costs. In practical terms, AHCM asks whether a state has accumulated enough reserves to handle a severe downturn based on its own experience. The US Department of Labor treats an AHCM of 1.0 as the minimum level for adequate solvency going into a recession.[28]
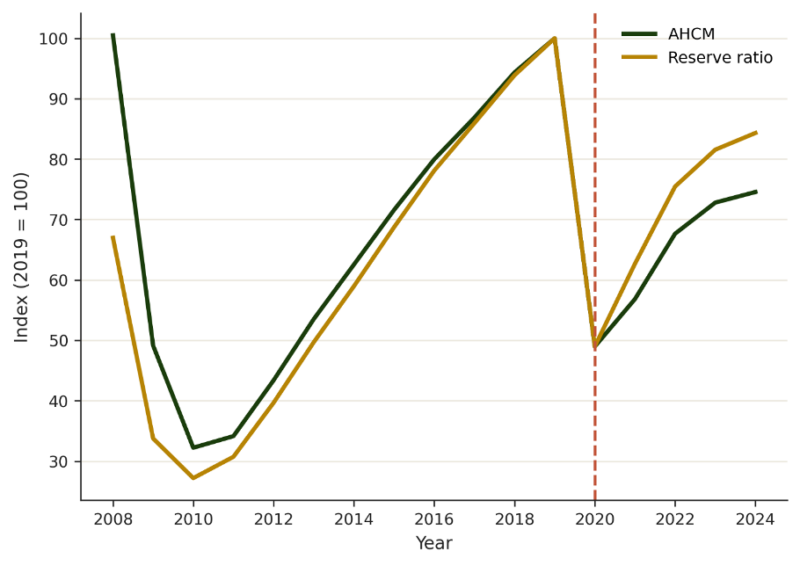
The reserve ratio provides a more direct balance-sheet measure of trust fund health. It compares the size of the trust fund to the state’s covered wage base, offering a snapshot of available resources relative to the payroll base that finances the system. Both AHCM and reserve ratio measurements are included in Figure 4 (below).
Figure 4: Solvency Measures Over Time (50 State Plus DC Average)
Sources: U.S. Department of Labor, State Unemployment Insurance Trust Fund Solvency Report 2026
Neither measure is perfect. The AHCM is useful because it incorporates a state’s own history of benefit costs, but it can also reflect past policy and labor market conditions that may not fully describe future risks. The reserve ratio is simpler and more transparent, but it does not account for how costly downturns have historically been in a particular state.
The analysis therefore treats the two measures as complements rather than substitutes. A state may appear stronger under one measure than the other, depending on its benefit history, wage base, and current reserve position. Using both helps distinguish between current financial capacity and preparedness for severe stress.
Across the results, the main patterns are generally consistent. Where the measures diverge, the differences are informative. The AHCM emphasizes resilience under historically costly conditions, while the reserve ratio emphasizes current fund strength relative to taxable wages.
Together, they provide a clearer picture of whether states had had sufficient reserves not only in nominal terms, but also relative to the severity of shocks the UI system is designed to absorb.
2.4 The 2020 Solvency Shock
The COVID-19 recession placed immediate pressure on state unemployment insurance trust funds. Claims rose rapidly in early 2020, while payroll tax revenues adjusted more slowly. This timing mismatch is a structural feature of the unemployment insurance system: benefit obligations rise quickly during downturns, while revenue collections respond more slowly and remain constrained by preexisting tax schedules. As a result, states entered the recession with different levels of fiscal preparedness despite operating within the same federal-state framework.[29]
The federal government responded in 2020 by temporarily expanding unemployment insurance. The Families First Coronavirus Response Act provided emergency administrative funding and regulatory flexibility to help states process the surge in claims. The CARES Act then created three major federal programs: Pandemic Unemployment Assistance, Pandemic Emergency Unemployment Compensation, and Federal Pandemic Unemployment Compensation.[30]
Pandemic Unemployment Assistance expanded eligibility beyond the regular state unemployment insurance system to workers who would not normally qualify for benefits. This included self-employed workers, independent contractors, workers with limited work histories, and others who were unemployed, partially unemployed, or unable to work for specified COVID-19-related reasons.[31]
Pandemic Emergency Unemployment Compensation provided up to 13 additional weeks of benefits to individuals who exhausted regular unemployment benefits and remained eligible.[32] Federal Pandemic Unemployment Compensation added $600 per week to unemployment benefits for eligible individuals for weeks ending on or before July 31, 2020.[33]
These unemployment supplements should be distinguished from the Economic Impact Payments sent directly to eligible taxpayers. The unemployment programs, by contrast, were tied to benefit eligibility and administered through state workforce agencies.
The CARES Act also changed the financing of unemployment programs during 2020. It provided full federal funding for Pandemic Unemployment Assistance, Federal Pandemic Unemployment Compensation, and Pandemic Emergency Unemployment Compensation. It temporarily funded the first week of regular unemployment compensation in states that waived the waiting period. It also provided relief for reimbursing employers, including state and local governments, certain nonprofit organizations, and federally recognized Indian tribes.34 The law further supported Short-Time Compensation, or work sharing, by reimbursing qualifying benefit costs and authorizing grants for implementation, administration, and promotion of state work-sharing programs.[35]
After the $600 weekly supplement ended, the federal government authorized Lost Wages Assistance through the Federal Emergency Management Agency. Lost Wages Assistance was not financed through the regular unemployment insurance trust fund structure. Instead, it was funded through FEMA’s Disaster Relief Fund and administered in coordination with state unemployment agencies. Eligible claimants could receive a $300 federal supplement, and states were permitted to add $100, bringing the possible weekly supplement to $400.[36]
State benefit levels differed because each state sets its own minimum and maximum unemployment insurance benefits. The federal supplements temporarily increased total payments to claimants, but they did not eliminate underlying differences across state systems. Nor does federal law require states to maintain a specific trust fund balance. Instead, states operate on a forward-funding basis, accumulating reserves during stronger labor-market periods to prepare for higher benefit payments during recessions.[37]
The fiscal effect was a rapid drawdown of state trust fund balances. Both AHCM and reserve-ratio measures declined sharply in 2020. In many states, reserves accumulated over several years were depleted in a much shorter period. The shock was national, but its effects were not uniform. Some states experienced moderate deterioration and began recovering once labor markets stabilized. Others saw deeper declines and remained financially strained for longer.
These differences matter because they reveal variation in state preparedness. Systems with stronger starting positions were better able to absorb the recessionary shock. Systems with weaker reserves were more exposed to borrowing, delayed recovery, and greater pressure for tax or benefit adjustments. This pattern reflects a limited form of fiscal path dependence, in which prior trust fund conditions shaped the options available to states when unemployment surged. Earlier fiscal choices constrained the range of feasible responses once the 2020 shock occurred. The 2020 experience shows that unemployment insurance can provide substantial countercyclical support during a recession, but it also shows that trust fund solvency remains a central measure of state fiscal resilience.
The policy debate over emergency UI also focused heavily on labor-market incentives. In 2020, Casey Mulligan and Stephen Moore warned that the $600 bonus unemployment payments and payroll tax suspension would create competing incentives: unemployment supplements would reduce the return to work for some workers, while payroll tax relief would support employment. Later work by Mulligan, et al argued that bonus unemployment payments weakened work incentives.[38]
That literature helps explain why the duration of federal pandemic UI programs became a contested policy question in 2021. This paper does not estimate the labor-supply effect of those programs. Instead, it examines whether state trust fund outcomes differed across states with different starting conditions, policy timing, implementation paths, borrowing exposure, and administrative capacity.
The policy implication is that forward funding matters. UI systems can provide countercyclical support during recessions, but states enter downturns with varying fiscal capacity. When the federal government offers supplemental payments to unemployment benefits, state policymakers are incentivized to treat UI trust fund solvency as a secondary concern during periods of economic boom. They then face fewer options when claims rise, reserves fall, and borrowing becomes necessary. This, in turn, can further incentivize rent-seeking for additional federal support.
2.5 Pandemic Spending Persists in 2021
During the pandemic, the federal government expanded unemployment benefits and eligibility through temporary programs layered on top of state UI systems. These programs provided additional support, but also changed the
incentives facing workers, employers, and state policymakers. The expansion occurred as state trust funds were already under severe stress. According to the analysis, every state except Arizona, Idaho, Maine, North Dakota, and South Carolina experienced a decline in recession preparedness after 2020. Thirty-seven states fell below the “adequate solvency” threshold in 2021, leaving them poorly positioned for another recession.[39]
The federal programs did not end uniformly. Some states participated until the September 2021 expiration date, while others exited earlier. Across empirical specifications, earlier withdrawal is associated with stronger trust fund outcomes during the recovery period. This relationship appears across both solvency measures but should be interpreted carefully. Early exit states may have differed from states that remained in the programs in ways that also affected trust fund recovery, including labor market conditions, fiscal capacity, political preferences, or administrative capacity. The evidence therefore supports a consistent association, not a definitive causal claim.
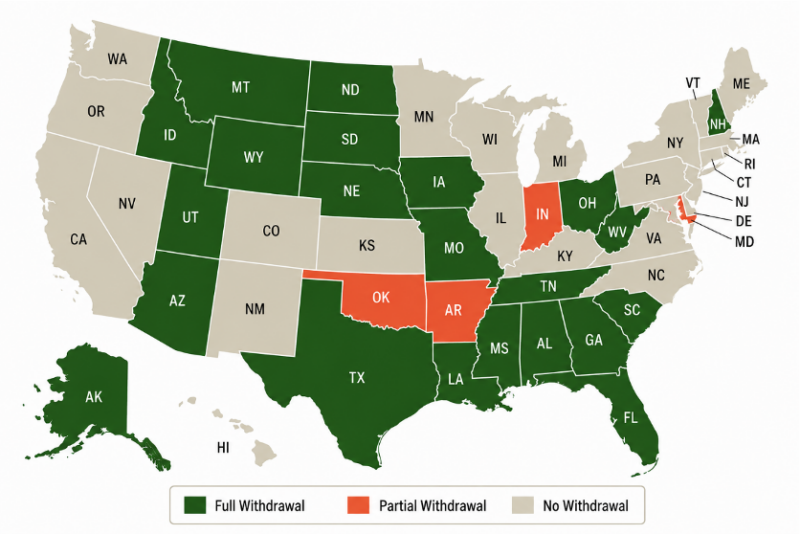
Pandemic-era policy decisions became part of the institutional environment in which states managed their UI systems. By July 2021, half of the states had announced plans to end bonus UI payments before the federal programs expired in September 2021. Most ended the payments in June, with several ending in July.[40] Arkansas, Indiana, Maryland, and Oklahoma attempted early withdrawal but faced legal or administrative challenges that kept the states enrolled in the programs until September. These states are treated separately because partial withdrawal did not create the same policy environment as full withdrawal.
Emergency programs can alter state incentives. When federal policy expands benefits or eligibility, state officials face different tradeoffs than they would under ordinary UI financing rules. In addition to CARES Act funding in 2020, 22 states took Title XII advances, which are federal loans available when state unemployment insurance trust fund balances reach zero. The analysis also reports that seventeen states had an AHCM of zero, indicating that their UI trust funds had no remaining balance.[41]
These weak positions were not random. With the exceptions of Hawaii, Nevada, and New Mexico, these states were already poorly prepared for the 2020 downturn, and the downturn exposed and accelerated preexisting solvency problems.
Program integrity problems compounded the fiscal strain. GAO reported that Pandemic Unemployment Assistance expanded UI eligibility to workers not previously covered by regular unemployment insurance, including self-employed workers and certain gig workers. States had to implement the program quickly, and the law initially allowed applicants to self-certify employment history and eligibility. Expanded eligibility, rapid implementation, and self-certification increased fraud risk. GAO later estimated that pandemic UI programs, including PUA, were subject to $100 billion to $135 billion in fraud from April 2020 through May 2023.[42] GAO also found that states’ fraud controls varied and evolved during the pandemic, but some states applied new controls only to new claims rather than to continuing claims that had already been approved, leaving those programs vulnerable to fraud.[43]
The labor-market literature is mixed but relevant. The effects of expanded benefits were also part of the policy environment. Mulligan, Moore, and Antoni (2021), as well as Dublois and Ingram (2021), argue that expanded benefits reduced the return to work for many households.[44],[45]
Other studies reach more mixed conclusions about early withdrawal’s labor-market effects. Holzer, Hubbard, and Strain find that early termination increased flows from unemployment to employment, while also noting welfare tradeoffs.[46] Coombs, Dube, Jahnke, Kluender, Naidu, and Stepner find that early withdrawal substantially reduced UI receipt and produced a smaller increase in employment, with income and consumption losses for affected households.[47] Arbogast and Dupor find that ending emergency unemployment benefits was associated with a statistically significant increase in employment.[48]
Taken together, the evidence indicates that UI trust fund solvency depends on the size of the shock as well as the policy environment in which states respond. Federal emergency programs provided temporary support, but also affected incentives, increased administrative burdens, and interacted with already-weak trust fund positions. States that entered the pandemic with stronger reserves were better positioned to absorb the shock. States that entered with weaker reserves faced deeper drawdowns, greater reliance on borrowing, and slower recovery. The 2020 experience underscores the importance of forward funding, program integrity, and state-level policy choices before the next recession begins.
The policy implications are that emergency support can strain state administration, weaken fiscal discipline, and obscure the condition of state UI trust funds, especially when such support is poorly designed. Reforms must therefore focus on financing rules, program integrity, and state flexibility, in addition to benefit levels, before the next downturn.
Figure 5: State Withdrawal from Pandemic Bonus Unemployment Programs
Note: Image designed in Python with assistance from ChatGPT.
Source: U.S. Department of Labor, Congressional Research Service, Foundation for Government Accountability.
2.6 Full vs. Partial Withdrawal
Some states experimented with ways to use the end of bonus payments to encourage labor-market reentry. Montana and South Carolina were early movers. Their governors announced that the states would end participation in several federal programs created under the CARES Act and extended under ARPA, including the additional $300 per week in federal unemployment benefits.[49] Figure 5 outlines states by withdrawal status.
The distinction between full withdrawal and partial withdrawal is central to this paper’s empirical design. A simple early-withdrawal indicator can obscure important differences between announcement and implementation. Arkansas, Indiana, Maryland, and Oklahoma attempted early withdrawal but faced legal, administrative, or implementation complications. As a result, they should not be treated as equivalent to states that fully sustained withdrawal.[50]
CRS reports that state courts in Indiana and Maryland issued orders prohibiting early termination from some or all COVID-19 UI programs.[51] Ballotpe-dia’s state-by-state tracker records similar implementation complications:
Indiana announced an end to participation effective June 19, 2021, but a court order required the state to resume participation; Maryland announced an end effective July 3, but a Baltimore Circuit Court ruling required continued participation; Oklahoma ended participation June 26, but an Oklahoma County judge later ordered reinstatement; and Arkansas announced an end effective June 26.[52]
The findings of this paper confirm that partial withdrawal does not replicate the full-withdrawal pattern. When partial-withdrawal states are separated from full-withdrawal states, the coefficients differ; the partial group does not behave like the full-withdrawal group. This result reinforces the importance of distinguishing between formal policy announcements and sustained implementation.
This finding shows that the state policy environment was shaped by implementation, not by announced intent. States that fully exited experienced one kind of administrative and fiscal path; states that attempted to exit but were delayed or constrained experienced another.
2.7 Timing Matters
The analysis does not stop with whether a state exited federal pandemic UI programs early. It also considers when that exit occurred.
That timing matters. States that withdrew earlier from the temporary federal programs tend, on average, to show stronger improvements in UI trust fund solvency during the recovery period. The relationship appears across multiple specifications and under both primary solvency measures.
The mechanism is plausible. Longer participation in expanded benefit programs may have prolonged elevated outflows from state UI systems. Earlier withdrawal may have shortened that period of pressure, allowing trust funds to stabilize sooner once labor market conditions improved.
The interpretation should remain measured, however. States did not exit at random. Early-exit states may have differed from late-exit states in labor market strength, fiscal condition, political preferences, administrative capacity, or other institutional features that are difficult to observe fully. Even with controls, these differences cannot be ruled out.
The evidence therefore supports a narrower conclusion: timing is consistently associated with trust fund recovery. It does not, by itself, prove that earlier exit caused stronger solvency outcomes.
That distinction matters. Policy timing may have affected fiscal recovery, but it operated within broader state systems. A state with stronger pre-pandemic reserves, more favorable labor market conditions, and greater administrative capacity would be expected to recover differently than a state lacking those advantages.
Even so, the pattern is meaningful. Emergency programs are often debated as if participation is simply on or off. The evidence here suggests duration also matters. The length of time a state remains in an extraordinary benefit regime can shape the fiscal environment in which recovery occurs.
2.8 Debt and Borrowing
When UI trust funds were exhausted, many states borrowed to continue paying benefits. That borrowing solved an immediate liquidity problem. It did not solve the underlying solvency problem.
The findings of this paper show that higher borrowing is associated with weaker trust fund positions in subsequent years. This is consistent with the basic mechanics of debt finance. Debt allows a state to meet obligations today by shifting costs into the future. Once the crisis passes, repayment still must occur.
That repayment burden can slow rebuilding reserves. States with outstanding obligations may face pressure to raise payroll taxes, impose surcharges, reduce benefits, or rely on other financing mechanisms. These choices can restore balance over time, but they also make recovery more difficult.
DOL explains that states may borrow from the federal government through the Title XII program when trust fund balances are exhausted. States may also use private-sector borrowing instruments, such as revenue bonds, to repay federal loans. DOL’s 2026 report notes that two states had outstanding Title XII advance balances as of January 1, 2026, totaling $21.4 billion, and that one state had outstanding private borrowing instruments totaling an estimated $1.86 billion.[53],[54]
The form of debt appears less important than the presence of debt itself. Whether liabilities take the form of federal loans or bonded obligations, they represent claims on future UI system resources. States may change the timing, interest cost, or political visibility of repayment, but they cannot eliminate the liability.
This is the basic tradeoff of crisis finance. Borrowing can be necessary when a trust fund is depleted during a downturn, but it also reveals that the system was not sufficiently prepared for the stress it faced. Debt provides breathing room, not solvency.
The interpretation requires caution. Borrowing is not randomly assigned.
States borrow because their trust funds did not have sufficient reserves to finance benefit payments without additional federal support. This form of fiscal stress can appear through federal Title XII advances, private borrowing instruments, delayed repayment, or future employer tax increases. Borrowing should, therefore, be interpreted both as a marker of prior weakness and as a mechanism that can carry the costs of the downturn into later years. A negative borrowing coefficient may reflect reverse causality: weak trust funds produce borrowing, rather than borrowing alone producing weak trust funds.
The defensible conclusion is that borrowing identifies states under greater trust fund strain, and those states tended to experience weaker post-pandemic solvency outcomes.
2.9 Improper Payments
The analysis also considers improper payment rates as a measure of administrative performance. The measure is imperfect, but it is still informative.
Improper payments include both errors and misrepresentation. They do not capture every form of administrative weakness, and they do not distinguish cleanly between fraud, claimant mistakes, employer reporting issues, and agency processing failures. Still, they provide one window into whether a UI system is operating with sufficient integrity under pressure. DOL’s Benefit Accuracy Measurement program provides state-level improper payment estimates and root-cause information, making it useful for examining administrative performance despite measurement limitations.[55]
The results suggest that higher improper payment rates are often associated with weaker or slower improvements in trust fund solvency. This relationship is less stable than the relationships observed for starting solvency, policy timing, and borrowing. That instability counsels caution.
Measurement is a serious problem. Reported improper payment rates reflect both underlying improper payments and the capacity to detect them. A state with stronger oversight may report more improper payments precisely because it finds more problems. A state with weaker oversight may appear cleaner than it is.
That makes interpretation difficult. A high reported rate may indicate poor administration, better detection, or both. A low reported rate may indicate sound management, under-detection, or both. The measure should therefore be read as suggestive, not definitive.
Even with those caveats, the administrative dimension cannot be ignored. UI trust funds are administered systems. Eligibility determinations, payment controls, employer reporting, appeals, fraud detection, and data systems all affect program performance.
The pandemic placed unusual pressure on those systems. GAO estimated that fraud in UI programs during the pandemic was likely between $100 billion and $135 billion from April 2020 through May 2023, or roughly 11 percent to 15 percent of total UI benefits paid during that period.[56] A weaker administrative system is one that has greater difficulty verifying eligibility, preventing improper payments, detecting fraud, processing claims accurately, and maintaining reliable data. In normal periods, these weaknesses can be partly concealed. During a shock, however, rapid program expansion can expose them. Where administration was weaker, the fiscal consequences may have been larger because weaker systems have difficulty administering benefits accurately under pressure. The evidence does not prove that improper payments drove solvency outcomes, but it supports the broader point that program integrity is part of fiscal resilience.
2.10 Policy and Administration Interaction
Policy choices do not operate in a vacuum. They are filtered through the administrative systems that carry them out. A state may adopt a sound rule, but the result depends on whether the rule can be implemented. Early withdrawal, fraud prevention, eligibility verification, and borrowing decisions all pass through state agencies with different levels of capacity. This means that UI reform must consider the institutional machinery that determines whether rules are enforced consistently, not just benefit generosity or tax rates.
The results suggest that the relationship between early program exit and improved solvency is stronger in states with lower improper payment rates. In states with higher improper payment rates, the relationship is weaker and less consistent. Because the improper payment specifications are less stable than the main policy and solvency specifications, this pattern should be treated as suggestive rather than central.
This pattern is consistent with a simple institutional explanation. Policy change is more likely to produce predictable fiscal effects when the administrative system implementing it is reliable. If eligibility controls, payment systems, and reporting practices are weak, the same policy change may have less direct or less measurable effects.
That does not mean improper payments alone determine trust fund outcomes. They do not. Nor does it mean administrative capacity is the only reason some states benefited more from early exit than others. The finding is an interaction, not a standalone causal mechanism.
The interaction is still important. It shows why formal policy design and administrative capacity should not be analyzed separately. A state may adopt a rule, announce a withdrawal, or change eligibility parameters, but those choices matter only to the extent that the system can implement them.
This is especially important during crises. Emergency programs often expand quickly, rely on strained agencies, and operate under political pressure to deliver payments rapidly. That environment increases the importance of administrative competence.
The evidence here suggests that policy effectiveness depends partly on institutional execution. States with stronger administrative systems may translate policy changes into fiscal outcomes more effectively. States with weaker systems may see those relationships blurred.
The broader lesson is that program design should account for implementation capacity from the beginning. A UI system that cannot reliably enforce rules during normal times is unlikely to do so well during a crisis.
2.11 Tax-Side Controls and Financing Structure
UI trust funds are financed primarily through employer payroll taxes, and state tax structures differ considerably. Taxable wage bases, experience-rating rules, tax schedules, and debt assessments all affect how states raise revenue for their UI systems. Those differences are part of the institutional background. DOL’s estimated employer contribution rates show wide variation across states in taxable wage bases and employer contribution rates, underscoring that UI financing differs substantially across state systems.[57]
The tax-augmented specifications provide a useful robustness check. They test whether the main results are simply capturing differences in UI financing structure. The findings of this paper suggest that the main pattern remains intact: pre-pandemic solvency continues to matter, early withdrawal timing remains directionally consistent, and the tax variables do not dominate the results.
Tax policy remains relevant. Taxable wage bases, employer tax schedules, experience rating, and debt assessments are central to how UI systems are financed. In these specifications, however, the tax-side controls function mainly as robustness checks. They belong in the Appendix and can be discussed briefly in the main text, but they should not displace the primary findings.
2.12 Contributions to the Existing Literature
The existing literature on pandemic UI has focused primarily on employment, household income, and consumption. Holzer, Hubbard, and Strain find evidence that early termination increased flows from unemployment to employment, while also noting welfare tradeoffs.[58] Coombs and coauthors find that early withdrawal sharply reduced UI receipt and produced a smaller increase in employment, while benefit losses were only partly offset by earnings gains and consumption fell.[59] Arbogast and Dupor find that ending emergency unemployment benefits had a positive employment effect.[60]
The Moore, Mulligan, and Antoni studies sharpen the incentive-side argument. They emphasize that the federal supplements raised replacement rates and, in their view, reduced the incentive to return to work. Their claims are relevant to the policy debate that motivated state early-withdrawal decisions, particularly the argument that extended participation could prolong labor-market disruption. This paper uses a different empirical outcome: fiscal solvency rather than employment flows.
This paper contributes a trust-fund perspective to the pandemic UI debate. It asks how state UI trust funds performed across different institutional and policy environments. That fiscal lens matters because UI is a state-administered financing system that must accumulate reserves, pay benefits during downturns, borrow when depleted, and rebuild afterward.
The paper’s results fit that institutional story. States with stronger pre-pandemic trust funds were better positioned after the shock. Earlier and more complete withdrawal from federal pandemic programs is associated with stronger trust fund outcomes. Partial-withdrawal states differ from full-withdrawal states. Borrowing exposure is associated with weaker solvency. Pro-gram integrity appears relevant, but the estimates are less consistent.
Those conclusions are narrower than a causal labor-supply claim, but they are important for understanding UI solvency. The pandemic showed that the same federal shock can produce different state-level fiscal outcomes because states begin with different reserves, administer programs differently, and make different policy choices during the recovery. Section 3 turns from diagnosis to reform, beginning with near-term improvements to program integrity and state flexibility before considering broader savings-based alternatives.
Section 3: Escaping the UI Trap
The COVID-19 Economic Downturn highlighted the structural weaknesses in the current Unemployment Insurance framework. The findings discussed in section 2 and the appendix do not by themselves prove that any single reform would restore solvency. They do show that UI trust fund performance depends on starting reserves, financing choices, administrative capacity, and policy implementation. Those patterns point to several reform priorities. While other analyses offer fixes to the existing system, this section offers alternative frameworks to the current UI program.[61]
Savings-based reform must account for institutional path dependence. The current UI system is embedded in federal tax rules, state trust fund accounts, employer experience rating, administrative agencies, and emergency federal backstops. A transition to universal savings accounts would therefore require staged reform rather than simple replacement. The institutional-design challenge is to move from the existing federal-state system toward a more portable, worker-controlled savings model.[62] Personal Unemployment Insurance Accounts (PISAs) and Universal Savings Accounts (USAs) are two examples.[63]
A PISA functions similarly to 401(k)s. These accounts are financed through payroll tax contributions from both the employer and employees. The employees fully own these accounts. When the worker is unemployed, he or she can make withdrawals to compensate for the loss of their income. When the worker does go back to work, he or she can build their PISA balance back up. Upon retirement, retirees can also use PISAs to bolster their retirement income or transfer funds to their heirs.[64]
PISAs were initially pioneered by Chile in 2002 and are currently in place in several Latin American countries as well as in Austria and Jordan.[65] In addition to the PISAs, Chile also includes a public safety net, known as the solidarity fund, financed by employers and the government, similar to UI trust funds.[66] As de Rugy notes, the solidarity fund creates the same incentives not to work as a traditional UI, such as postponing a search for a new job until benefit payments are expected to stop.[67]
A recent analysis of the PISAs in Chile found that the moral hazard — workers postponing their employment until solidarity fund benefit payments ran out — was minimized because the requirements to use the solidarity fund are stringent.[68] While workers have full access to their PISAs, they must make 12 contributions to the solidarity fund within 24 months to qualify to access the solidarity fund. Most workers in Chile did not make the 12 contributions.[69] If the barriers to the solidarity fund were lowered, it is reasonable to expect the risk of moral hazard to increase.
One tradeoff of PISAs, however, is the added complexity to the tax code. By the end of 2026, the federal tax code will provide 13 different tax-advantaged savings vehicles, each with different rules, limitations, and regulations.[70],[71]
Adding further complexity to the existing tax code can disadvantage many workers. A solution to this challenge, as discussed in “The Work vs. Welfare Trade-Off Revisited,” is universal savings accounts (USAs).[72]
Economist Adam Michel describes a USA as an account “that would function similarly to retirement accounts — income saved in the account would only be taxed once — but without restrictions on who can contribute, on what the funds can be used for, or when they can be spent.”[73] Michel and others have noted that current tax and fiscal policy punishes savings through income and payroll taxes and then again through corporate income taxes, taxes on investment income, or taxes on transfers (i.e. taxes on gifts and inheritance).[74],[75] McBride, et al. (2024) also notes that USAs are in place in Canada and the United Kingdom, where “tax-advantaged savings vehicles with unrestricted use of funds” allow citizens to secure financial stability.[76]
These reforms can help get people back to work, allow them to keep more of the money they earn, and reduce wasteful spending and strains on state budgets.
Building a Stronger Alternative
The unexpected economic downturn of 2020 highlighted the vulnerabilities of many unemployment insurance trust funds. States entered the crisis with different levels of preparedness, and those starting positions shaped how well they absorbed the shock. States with stronger pre-2020 solvency tended to remain stronger afterward. States that exited federal programs earlier and more completely generally had stronger trust fund outcomes, while partial withdrawal states followed a different pattern.
These findings identify consistent associations rather than definitive causal effects. States did not choose policies at random, and borrowing often reflected preexisting stress. Even so, the evidence points to an institutional lesson: UI solvency is shaped by incentives, fiscal rules, and administrative capacity. Near-term reforms should improve program integrity, financing rules, and state flexibility. A more durable reform would move toward savings-based alternatives that give workers greater control, reduce reliance on federal backstops, and limit the fiscal vulnerabilities exposed by the pandemic.
Appendix
Glossary of Terms
This appendix defines terms used in this paper. Definitions are drawn from the US Department of Labor Handbook 394.[77]
- Adjusted Debt Ratio: A measure of UI debt relative to covered wages or trust fund balance.
- Average High Cost Multiple (AHCM): A standard measure of unemployment insurance (UI) trust fund solvency. It is calculated as the ratio of a state’s reserve ratio to the average of its three highest benefit-cost rates over the past 20 years. An AHCM of 1.0 is commonly interpreted as a minimum solvency benchmark, though adequacy depends on the severity of a recession.
- Average High Cost Rate (AHCR): The average of the three highest benefit cost rates over the previous 20 years. This approximates historical peak payout intensity and serves as the denominator in the AHCM calculation.
- Benefit Cost Rate (BCR): The ratio of total UI benefits paid to total covered wages each year. It measures the benefit outflows relative to the state’s wage base.
- Bond Financing: State-issued debt used to repay federal UI loans, typically repaid via employer payroll taxes.
- Covered Employment: The number of workers employed in jobs covered by the UI system. Coverage varies by state and excludes certain worker categories defined in statute.
- Covered Wages (Total Wages): Total payroll paid to workers in covered employment. This serves as a key denominator for solvency metrics such as the reserve ratio and benefit cost rate.
- Early Withdrawal: A state’s decision to terminate participation in federal pandemic UI programs prior to their federal expiration date.
- Experience Rating: A system that adjusts employer UI tax rates based on their history of layoffs and benefit claims. Employers with higher layoff rates typically face higher tax rates.
- Federal Pandemic Unemployment Programs: Temporary UI expansions enacted under the CARES Act and subsequent legislation, including programs such as Pandemic Unemployment Assistance (PUA), Federal Pandemic Unemployment Compensation (FPUC), and Pandemic Emergency Unemployment Compensation (PEUC). These programs were federally funded and largely outside standard state trust fund financing structures.
- Forward Funding: The practice of accumulating UI trust fund reserves during economic expansions to finance benefit payments during recessions without requiring borrowing.
- Insured Unemployment Rate (IUR): The number of individuals receiving UI benefits as a percentage of covered employment. This differs from the total unemployment rate, as it only includes individuals eligible for and receiving UI benefits.
- Partial Withdrawal: Cases where states attempted early withdrawal but continued partial participation due to legal or administrative constraints (e.g., AR, IN, MD, OK).
- Post-2021 Indicator: Binary variable indicating periods after federal pandemic UI program phaseout.
- Replacement Rate: The share of a worker’s prior wages that is replaced by UI benefits. Higher replacement rates increase income support but may affect work incentives.
- Reserve Ratio: The ratio of a state’s UI trust fund balance to total covered wages. It measures the size of reserves relative to the state’s economic base.
- Solvency (UI Trust Fund Solvency): The ability of a state’s UI trust fund to meet benefit obligations without borrowing or requiring emergency funding. Typically evaluated using the AHCM.
- Taxable Wage Base: The maximum amount of each worker’s wages subject to UI payroll taxes. States set their own taxable wage bases, which affect revenue generation.
- Title XII Advances (Federal Loans): Loans provided to states by the US Treasury when their UI trust fund balances are insufficient to cover benefit payments. These loans must generally be repaid with interest. A state’s “Title XII Borrowing Status” refers to whether a state has outstanding federal UI loans.
- Total Benefits Paid: The total amount of unemployment benefits disbursed in a given year, including both state and federal funded programs enacted during the COVID-19 economic downturn.
- Trust Fund Balance (Reserves): The amount of funds held in a state’s UI trust fund, typically measured at the end of the calendar year. This represents the resources available to pay benefits.
- Unemployment Insurance(UI): A joint federal-state program that provides temporary income support to eligible workers who lose their jobs through no fault of their own.
- Unemployment Rate: The percentage of the labor force that is unemployed and actively seeking work, typically measured by the Bureau of Labor Statistics. This is broader than UI participation and includes individuals not receiving benefits.
- Weeks Compensated: The total number of weeks for which UI benefits are paid to recipients. This reflects both the number of beneficiaries and the duration of benefits.
- Year-End Federal Loans (Title XII Balance): The outstanding balance of federal loans to a state unemployment insurance trust fund at the end of the calendar year. Positive balances indicate that the state borrowed from the US Treasury to finance benefit payments.
The following definitions come from the US Government Accountability Office relating to improper payments:[78]
- Improper Payments: Payments that should not have been made or that were made in the incorrect amount; typically they are overpayments. The Improper Payment Rate is the share of total UI payments classified as improper.
- Fraud: Obtaining something of value through willful misrepresentation. Fraud can sometimes involve benefits that do not result in direct financial loss to the government (such as passport fraud). While all fraudulent payments are considered improper, not all improper payments are due to fraud.
- Waste: When individuals or organizations spend government resources carelessly, extravagantly, or without purpose.
- Abuse: When someone behaves improperly or unreasonably or misuses a position or authority using federal resources.
Data
The US Department of Labor publishes an annual report on unemployment trust fund solvency in 50 states plus DC, Puerto Rico, and the US Virgin Islands.[79] The most recent report was published in April 2026. These reports provide a clear picture of state trust fund conditions before and after the federal unemployment programs enacted by Congress.
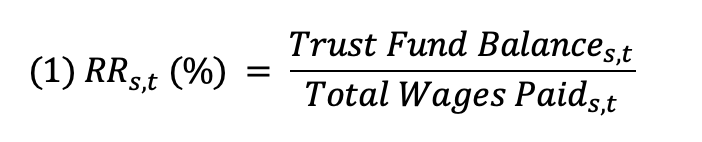
When the Department of Labor examines UI trust fund solvency, it looks at more than just the dollar amount in the trust fund. First, the Department measures the Reserve Ratio. The Reserve Ratio is the trust fund balance divided by the total wages (earned both in the public and private sector) paid for that year.[80] The Reserve Ratio (RR) for state s in year t is expressed as a percentage in Equation 1.
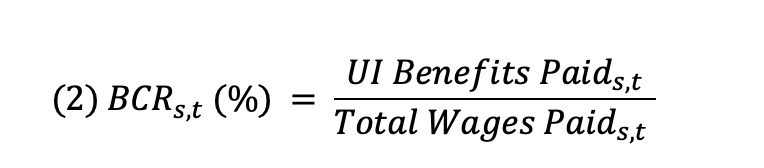
Next, the Department compares the Reserve Ratio to the Benefit Cost Rate. The Benefit Cost Rate is the dollar amount of unemployment benefits paid in a year divided by total wages paid in that same year.[81] The Benefit Cost Rate (BCR) for state s in year t (expressed as a percentage) is shown in Equation 2.
The Department then compares the current Reserve Ratio with the state’s high-cost experience. One common measure uses the average of the three highest Benefit Cost Rates during the previous 20 years. This measure, the Average Benefit Cost Rate (ABCR) for state s in year t, is shown in Equation 3.[82]
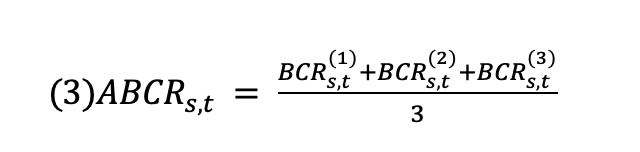
Where BCR(1) (s,t), BCR(2) (s,t) and BCR(3) (s,t) are the three highest annual Benefit Cost Rates for state s during the 20-year lookback period used for year t.
The Department then calculates the Average High Cost Multiple by dividing the current Reserve Ratio by the Average Benefit Cost Rate. The result is the Average High Cost Multiple. This measure, the Average High Cost Multiple (AHCM), for state s in year t, is shown in Equation 4.[83]
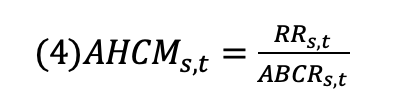
The Department of Labor considers a UI trust fund to have “adequate solvency,” meaning it is prepared for a recession, if the Average High Cost Multiple is greater than or equal to one. The closer the AHCM is to zero, the less prepared a state is for the next recession.[84]
Methods
This analysis uses a state-year panel to examine variation in state unemployment insurance trust fund solvency before, during, and after the COVID-19 downturn. The unit of observation is the state-year, and the sample includes all 50 states and the District of Columbia over the years covered by the final dataset.
The analysis employs two dependent variables. The first is the Average High Cost Multiple, or AHCM, which measures a state trust fund’s reserve relative to histor-ical high-cost benefit experience. AHCM is used as the primary solvency measure because it captures a state’s capacity to withstand periods of elevated benefit pay-ments. The second is the reserve ratio, which measures trust fund reserves relative to the covered wage base. Using both measures allows the analysis to distinguish between forward-looking solvency and the fund’s current accounting position.
The baseline empirical specification is a two-way fixed-effects model:

where Yst is either AHCM or reserve ratio for state in year t. Solvency2019s is the state’s pre-pandemic solvency measure, matched to the dependent variable where appropriate. Early Withdrawals captures the timing of sustained withdrawal from federal pandemic unemployment insurance programs. State fixed effects, Ys, control for time-invariant differences across states, including long-standing institutional differences in UI tax systems, benefit rules, industrial composition, and administrative structure. Year fixed effects, St , control for shocks common to all states in a given year, including the pandemic recession, federal UI legislation, national labor-market conditions, and inflationary pressures. Standard errors are clustered by state.
The models estimate conditional associations rather than definitive causal effects. Early withdrawal decisions were not randomly assigned. States that withdrew earlier may have differed from other states in labor-market recovery, fiscal capacity, political institutions, administrative capacity, or other unobserved factors. State and year fixed effects reduce some sources of confounding, but they do not eliminate all policy endogeneity or differential state trends.
The paper estimates several alternative policy specifications. One specification separates full-withdrawal states from partial-withdrawal states:

This specification allows full-withdrawal and partial-withdrawal states to differ from the comparison group after the pandemic-policy period. The distinction is important because partial-withdrawal states announced or attempted early withdrawal but did not sustain withdrawal in the same way as full-withdrawal states.
A policy-intensity specification replaces the withdrawal indicators with a continuous measure of withdrawal timing:

In this specification, WithdrawalIntensitys measures the extent to which a state exited federal pandemic UI programs before their scheduled expiration.
The paper also estimates lagged-debt specifications:

where Borrowed s,t-1 indicates whether a state had borrowing exposure in the prior year. These models test whether debt exposure is associated with weaker trust fund outcomes after accounting for initial solvency and policy timing. Because borrowing is likely endogenous to trust fund stress, the debt coefficients are interpreted as associations rather than causal effects.
Program-integrity specifications add improper-payment and fraud measures:

These models examine whether administrative-capacity measures are associated with variation in trust fund outcomes. Because improper-payment and fraud data are not available for the full panel and may vary in measurement across states and years, these estimates are treated as supplementary mechanism checks.
The paper also estimates an interaction specification:

This model tests whether the association between policy timing and trust fund outcomes differs with the level of improper payments. Additional specifications split the sample into high- and low-improper-payment groups to assess heterogeneity.
Finally, the paper estimates difference-in-differences and event-study models as supplemental checks. The difference-in-differences model compares post-policy changes in full-withdrawal states with the comparison group:

The event-study model estimates year-specific differences around the pandemic-policy period:

The omitted event-time category is the pre-policy reference year. These estimates are used to examine timing and assess whether treated and comparison states displayed differential pre-policy trends. Where pre-period coefficients differ from zero, the event-study estimates are interpreted as diagnostic rather than causal.
Robustness checks include models excluding the largest states, specifications using winsorized dependent variables, and specifications omitting the 2019 solvency control. These checks test whether the main associations are sensitive to influential states, extreme values, or the inclusion of baseline solvency.
Empirical Results
This Appendix reports the regression results supporting the discussion in Section 2. The models examine state unemployment insurance trust fund solvency before, during, and after the COVID-19 downturn. The dependent variables are the Average High Cost Multiple (AHCM) and the reserve ratio. AHCM is the primary solvency measure because it compares a state’s trust fund reserves with its historical high-cost experience. The reserve ratio is included as a secondary measure because it captures trust fund balances relative to covered wages.
The results should be interpreted as descriptive evidence. The models include state and year fixed effects where appropriate, and several specifications control for pre-pandemic solvency. These specifications identify associations between initial trust fund condition, pandemic-program withdrawal timing, withdrawal type, borrowing, program integrity, and post-pandemic trust fund outcomes. They do not establish definitive causal effects.
Initial Conditions with State and Year Fixed Effects
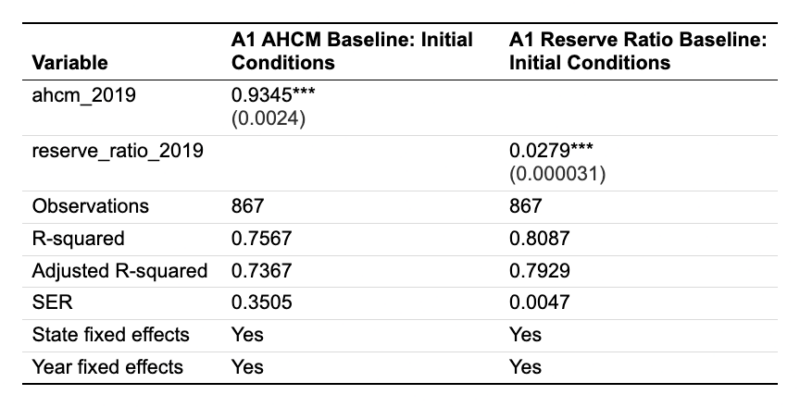
The first set of models examines whether pre-pandemic solvency predicts later trust fund conditions after accounting for state and year fixed effects. These models use 2019 AHCM and 2019 reserve ratio as baseline measures of state trust fund preparedness.
The results show strong persistence. States that entered the pandemic with stronger trust fund positions generally remained in stronger condition afterward. This pattern appears for both AHCM and the reserve ratio. The 2019 solvency measures are positive and statistically significant in the corresponding models, and the models have relatively high explanatory power. This is consistent with the interpretation in Section 2 that the pandemic did not hit all states equally: states entered 2020 with different reserve positions, and those starting conditions shaped later outcomes.
Full and Partial Withdrawal from Federal Pandemic Programs
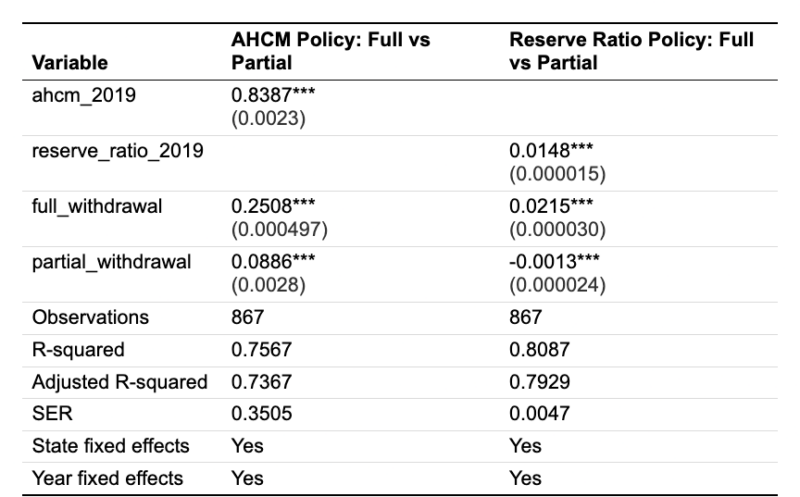
The second set of models separates states that fully withdrew from federal pandemic unemployment programs from states that partially withdrew. This distinction is important because announcement and implementation were not always the same. Some states announced or attempted early withdrawal but later faced legal, administrative, or implementation complications.
Arkansas, Indiana, Maryland, and Oklahoma are treated as partial-withdrawal cases. These states should not be grouped with states that fully sustained early withdrawal. The results indicate that full-withdrawal and partial-withdrawal states followed different empirical patterns. The partial-withdrawal group does not reproduce the same results as the full-withdrawal group.
This distinction supports the treatment of partial withdrawal as a separate category throughout the paper. The results do not prove that full withdrawal caused stronger trust fund outcomes, but they do show that full and partial withdrawal are not interchangeable in the data.
Table A2. Full and Partial Withdrawal Models
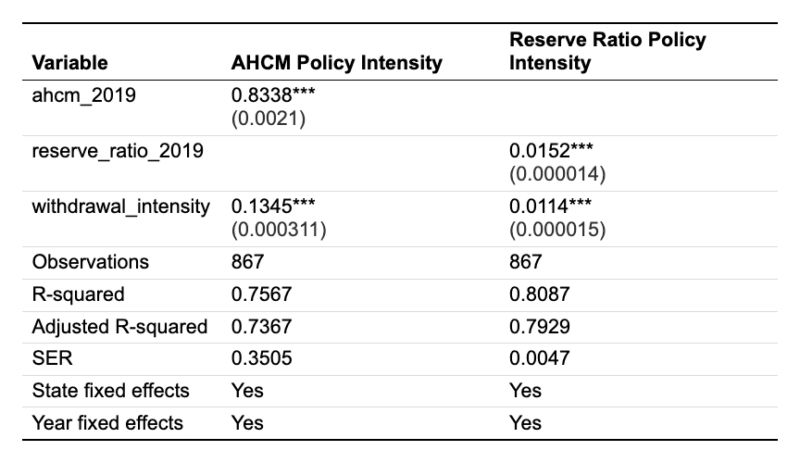
Policy Intensity (Continuous Timing Measure)
The third set of models examines policy intensity, measured through the timing and extent of early withdrawal from federal pandemic unemployment programs. These specifications focus on whether earlier sustained withdrawal is associated with stronger trust fund outcomes.
The results indicate that earlier sustained withdrawal is associated with stronger AHCM and reserve-ratio outcomes. This relationship appears in the policy-intensity specifications and is consistent with the main descriptive results discussed in Section 2. The interpretation should remain cautious.
Earlier withdrawal may reflect reduced benefit outflows or faster trust fund rebuilding, but it may also be associated with stronger labor-market recovery or fiscal conditions that made early withdrawal more feasible.
The most defensible conclusion is that states that exited earlier and more completely tended to show stronger trust fund outcomes. The estimates should be framed as associations rather than causal effects.
Table A3. Policy Intensity and Withdrawal Timing Models
Debt, Borrowing, and Tax-Side Controls
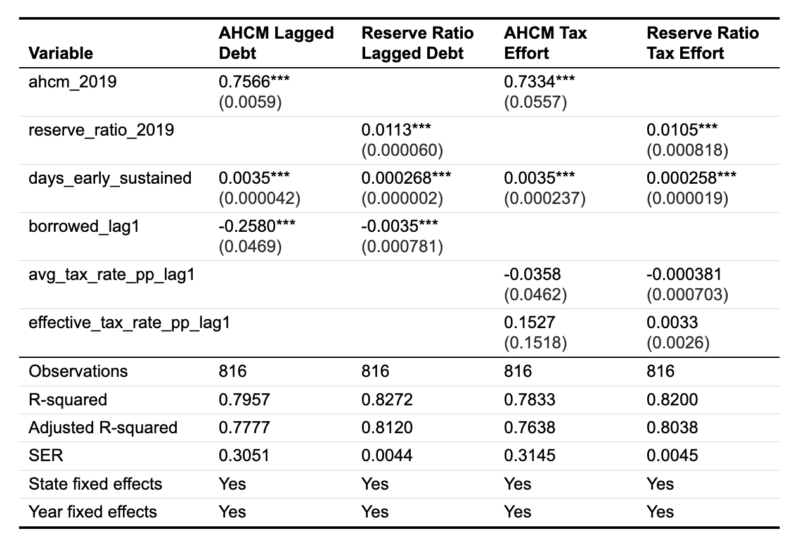
The fourth set of models examines borrowing exposure, debt-related variables, and tax-side controls. These specifications test whether the core findings remain when accounting for state financing pressures and UI tax-related measures.
The borrowing results generally point in the expected direction: states with borrowing exposure tend to show weaker trust fund outcomes. This should not be interpreted as proof that borrowing caused weaker solvency. Borrowing is likely a response to trust fund weakness. States borrow because they are under fiscal stress, so negative borrowing coefficients may reflect underlying weakness rather than an independent effect of borrowing itself.
The tax-side controls provide an additional check. UI tax policy is central to trust fund financing, but these specifications do not overturn the main findings.
Pre-pandemic solvency and withdrawal timing remain central to the empirical pattern. The tax variables should therefore be treated as supplementary controls rather than as the main explanatory result.
Table A4. Debt, Borrowing, and State Tax Controls
Program Integrity and Exploratory Administrative Capacity Models
The fifth set of models examines program integrity and administrative capacity, including improper payment measures and related exploratory specifications.
These results are less consistent than the main solvency, withdrawal, and borrowing results. Improper payment and fraud variables may help describe administrative capacity, but they should not carry the paper’s central empirical claim. Measurement issues are likely important. Improper payment data may vary across states and over time, and fraud-related measures may reflect detection and enforcement capacity as well as the underlying level of fraud.
For that reason, these specifications should be presented as exploratory. They are useful for showing that program integrity belongs in the broader UI solvency discussion, but the estimates are not stable enough to support strong conclusions about improper payments as a primary driver of trust fund outcomes.
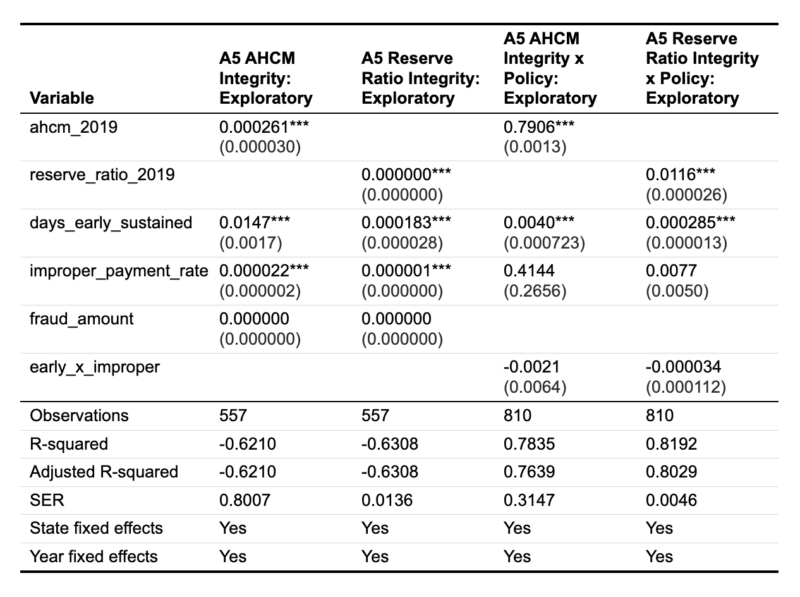
Note: Some integrity specifications are exploratory and they are reported to show sensitivity to administrative capacity measures. The main interpretation relies on the solvency, withdrawal, timing, and borrowing specifications, which are more stable across models.
Robustness Checks
The final set of models reports robustness checks. These tests examine whether the main empirical patterns are sensitive to influential states, alternative treatment of outcomes, or changes in model controls.
The specifications excluding large states and winsorized specifications preserve the main directional pattern: pre-pandemic solvency predicts later solvency; earlier and more complete withdrawal is associated with stronger trust fund outcomes; full withdrawal differs from partial withdrawal, and borrowing exposure is associated with weaker later outcomes. These results suggest that the main findings are not driven entirely by a small number of unusually large states or by extreme values in the dependent variables.
The specifications that omit 2019 solvency controls are less stable. In those models, some policy coefficients change more substantially, underscoring the importance of baseline solvency in explaining later trust fund outcomes. This does not negate the broader descriptive pattern, but it does show that pre-pandemic trust fund condition is not merely a background control. It is central to the empirical story. States entered the pandemic with different reserve positions, and those initial conditions explain a substantial share of the variation in later solvency.
The borrowing results require similar caution. Borrowing is not randomly assigned. States borrow because their trust funds lack sufficient reserves to finance benefit payments without additional support. This fiscal stress can appear through federal Title XII advances, private borrowing instruments, delayed repayment, or future employer tax increases. Borrowing should therefore be interpreted both as a marker of prior weakness and as a mechanism that can carry downturn costs into later years. A negative borrowing coefficient may reflect reverse causality: weak trust funds produce borrowing, rather than borrowing alone producing weak trust funds.
The program-integrity results are also less consistent than the main solvency and withdrawal results. Improper payments and related administrative measures remain relevant to the broader UI solvency story, but the robustness checks do not support treating them as the central empirical driver. They are better interpreted as secondary indicators of administrative capacity that may condition how states experience and recover from fiscal stress.
Taken together, the robustness checks support a disciplined interpretation of the results. The results are not wholly dependent on outliers or a single modeling choice, but they remain observational. Earlier and more complete withdrawal is associated with stronger post-pandemic trust fund outcomes, borrowing exposure is associated with weaker outcomes, and baseline solvency remains the most consistent predictor of later solvency. These patterns are durable enough to merit attention, but they should be read as descriptive associations rather than causal estimations.
Table A6. Robustness Checks
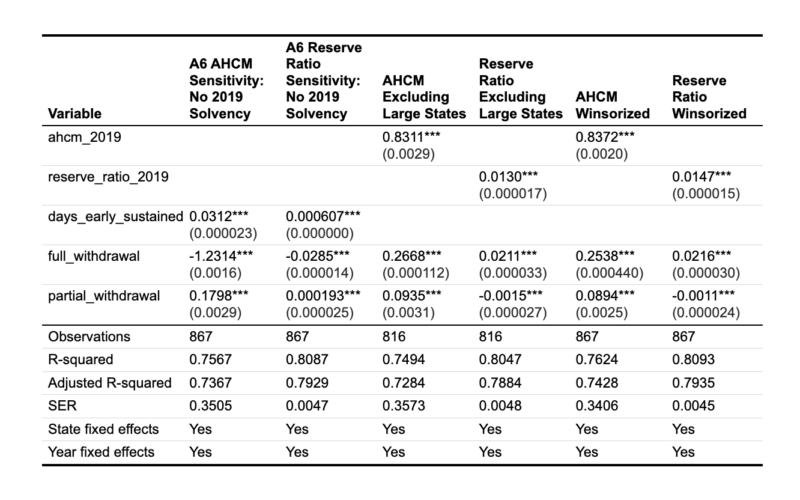
End Notes
[1] US Department of Labor, State Unemployment Insurance Trust Fund Solvency Report 2026 (Washington, DC: US Department of Labor, 2026), https://oui.doleta. gov/unemploy/solvency.asp.
[2] US Department of Labor, State Unemployment Insurance Trust Fund Solvency Report 2020 (Washington, DC: US Department of Labor, 2020), https://oui.doleta. gov/unemploy/solvency.asp.
[3] US Department of Labor, Employment and Training Administration, “Unemployment Insurance Fact Sheet,” accessed April 30, 2026, https://oui.doleta.gov/unemploy/ uifactsheet.asp.
[4] US Department of Labor, State Unemployment Insurance Trust Fund Solvency Report 2021 (Washington, DC: US Department of Labor, 2021), https://oui.doleta.gov/unemploy/solvency.asp.
[5] US Department of Labor, Solvency Report 2021.
[6] Julie M. Whittaker, “RS22077: Unemployment Compensation (UC) Financing,” Congressional Research Service, December 15, 2020; Emerson Sprick, “How Is the Unemployment Insurance Program Financed?,” Bipartisan Policy Center, March 15, 2022, https://bipartisanpolicy.org/explainer/how-is-the-unemployment-insur-ance-program-financed/.
[7] Edwin E. Witte, “An Historical Account of Unemployment Insurance in the Social Security Act,” Law and Contemporary Problems 3, no. 2 (1936): 155–69; Daniel N. Price, “Unemployment Insurance, Then and Now, 1935–85,” Social Security Bulle-tin 48, no. 10 (1985): 22–32; Ballotpedia, “Timeline of Unemployment Insurance,” accessed April 26, 2026, https://ballotpedia.org/Timeline_of_unemployment_in-surance.
[8] Witte, “Historical Account of Unemployment Insurance.”
[9] Price, “Unemployment Insurance, Then and Now,” 30.
[10] Price, “Unemployment Insurance, Then and Now,” 30.
[11] Price, “Unemployment Insurance, Then and Now,” 26–28; US Department of Labor, Fifty Years of Unemployment Insurance: A Legislative History, 1935–1985 (Washington, DC: Employment and Training Administration, 1986).
[12] Federal Reserve Bank of St. Louis, “Unemployment Insurance: A Tried-and-True Safety Net,” Page One Economics, December 1, 2020, https://www.stlouisfed.org/ publications/page-one-economics/2020/12/01/unemployment-insurance-a-tried-and-true-safety-net.
[13] Sprick, “How Is the Unemployment Insurance Program Financed?”
[14] Sprick, “How Is the Unemployment Insurance Program Financed?”
[15] William A. Niskanen Jr., Bureaucracy and Representative Government (Chicago: Aldine-Atherton, 1971).
[16] James M. Buchanan and Richard E. Wagner, Democracy in Deficit: The Political Legacy of Lord Keynes (New York: Academic Press, 1977).
[17] James M. Buchanan and Gordon Tullock, The Calculus of Consent: Logical Foundations of Constitutional Democracy (Ann Arbor: University of Michigan Press, 1962).
[18] US Bureau of Labor Statistics, “How the Government Measures Unemployment,” accessed June 28, 2021, https://www.bls.gov/cps/cps_htgm.htm#unemployed.
[19] US Department of Labor, Employment and Training Administration, “Unemployment Insurance Fact Sheet,” accessed April 28, 2021, https://oui.doleta.gov/ unemploy/docs/factsheet/UI_Program_FactSheet.pdf.
[20] US Department of Labor, Employment and Training Administration, “Unemployment Insurance Fact Sheet,” accessed April 28, 2021.
[21] US Department of Labor, Employment and Training Administration, Estimated Employer Contribution Rates, Calendar Year 2025 (Washington, DC: US Department of Labor, 2025).
[22] US Department of Labor, Solvency Report 2026.
[23] US Department of Labor, Solvency Report 2026.
[24] Julie M. Whittaker and Katelin P. Isaacs, Unemployment Insurance (UI) Benefits: Permanent-Law Programs and the COVID-19 Pandemic Response, CRS Report No. R46687 (Washington, DC: Congressional Research Service, January 31, 2022).
[25] Paul Pierson, “Increasing Returns, Path Dependence, and the Study of Politics,” American Political Science Review 94, no. 2 (2000): 251–67; Elinor Ostrom and Xavier Basurto, “The Evolution of Institutions: Toward a New Methodology,” SSRN Electronic Journal, 2009, https://doi.org/10.2139/ssrn.1934360.
[26] US Department of Labor, Solvency Report 2026.
[27] See Appendix Table A1. The initial conditions models report positive and statistically significant coefficients for 2019 solvency controls in both AHCM and reserve-ratio specifications.
[28] US Department of Labor, State Unemployment Insurance Trust Fund Solvency Report 2026.
[29] US Department of Labor, State Unemployment Insurance Trust Fund Solvency Report 2026.
[30] US Department of Labor, Employment and Training Administration, “Coronavirus Related Information for State Unemployment Insurance Agencies,” accessed April 26, 2026, https://oui.doleta.gov/unemploy/coronavirus/.
[31] US Department of Labor, Employment and Training Administration, “Coronavirus Aid, Relief, and Economic Security (CARES) Act of 2020 — Pandemic Unemployment Assistance (PUA) Program Operating, Financial, and Reporting Instructions,” Unemployment Insurance Program Letter No. 16-20, April 5, 2020, https://www.dol.gov/agencies/eta/advisories/unemployment-insurance-pro-gram-letter-no-16-20.
[32] US Department of Labor, Employment and Training Administration, “Coronavirus Aid, Relief, and Economic Security (CARES) Act of 2020 — Pandemic Emergency Unemployment Compensation (PEUC) Program Operating, Financial, and Reporting Instructions,” Unemployment Insurance Program Letter No. 17-20, April 10, 2020, https://www.dol.gov/agencies/eta/advisories/unemployment-in-surance-program-letter-no-17-20.
[33] US Department of Labor, Employment and Training Administration, “Coronavirus Aid, Relief, and Economic Security (CARES) Act of 2020—Summary of Key Unemployment Insurance (UI) Provisions and Guidance Regarding Temporary Emergency State Staffing Flexibility,” Unemployment Insurance Program Letter No. 14-20, April 2, 2020, https://www.dol.gov/agencies/eta/advisories/unemploy-ment-insurance-program-letter-no-14-20.
[34] US Department of the Treasury, “Economic Impact Payments,” accessed May 1, 2026, https://home.treasury.gov/policy-issues/coronavirus/assistance-for-ameri-can-families-and-workers/economic-impact-payments.
[35] US Department of Labor, Employment and Training Administration, “CARES Act of 2020 — Summary of Key Unemployment Insurance (UI) Provisions,” UIPL No. 14-20.
[36] US Department of Labor, Employment and Training Administration, “Presidential Memorandum on Authorizing the Other Needs Assistance Program for Major Disaster Declarations Related to Coronavirus Disease 2019 (COVID-19) — Unemployment Insurance (UI)-Related Technical Assistance for States Administering Lost Wages Assistance (LWA),” Unemployment Insurance Program Letter No. 27-20, August 12, 2020, https://www.dol.gov/agencies/eta/advisories/ unemployment-insurance-program-letter-no-27-20; US Department of Labor, “US Department of Labor Announces Guidance for the Lost Wages Assistance Pro-gram,” news release, August 12, 2020, https://www.dol.gov/newsroom/releases/ eta/eta20200812-0.
[37] US Department of Labor, Solvency Report 2026.
[38] Casey B. Mulligan, The Economic Effects of Pandemic Unemployment Programs (Committee to Unleash Prosperity, December 2020).
[39] US Department of Labor, Solvency Report 2021.
[40] Katelin P. Isaacs and Julie M. Whittaker, States Opting Out of COVID-19 Unemployment Insurance (UI) Agreements, CRS Insight No. IN11679 (Washington, DC: Congressional Research Service, updated August 20, 2021), https://www.congress. gov/crs-product/IN11679.
[41] US Department of Labor, Solvency Report 2026.buyer.com/opinion/will-the-fed-kill-the-municipal-bond-market
[42] US Government Accountability Office, Unemployment Insurance: Estimated Amount of Fraud During Pandemic Likely Between $100 Billion and $135 Billion, GAO-23-106696 (Washington, DC: Government Accountability Office, September 12, 2023), https://www.gao.gov/products/gao-23-106696.
[43] US Government Accountability Office. Pandemic Unemployment Assistance: States’ Controls to Address Fraud. GAO-24-107471. Washington, DC: Government Accountability Office, July 23, 2024. https://www.gao.gov/products/gao-24-107471.
[44] Casey Mulligan, Stephen Moore, and E. J. Antoni, “Bonus Unemployment Benefits Are Causing Major Labor Shortage in America,” Committee to Unleash Prosperity, June 2021, https://committeetounleashprosperity.com/wp-content/uploads/2021/06/CTUP_BonusUnemploymentBenefitsLaborShortage.pdf.
[45] Hayden Dublois and Jonathan Ingram, Even in Florida, Taxpayer-Funded Benefits During COVID-19 Pay Better than Returning to Work (Naples, FL: Foundation for Government Accountability, May 11, 2021), https://thefga.org/wp-content/ uploads/2021/05/Florida-Incentives-Not-to-Work.pdf.
[46] Harry J. Holzer, R. Glenn Hubbard, and Michael R. Strain, “Did Pandemic Unemployment Benefits Reduce Employment? Evidence from Early State-Level Expirations in June 2021,” NBER Working Paper No. 29575, December 2021.
[47] Kyle Coombs, Arindrajit Dube, Calvin Jahnke, Raymond Kluender, Suresh Naidu, and Michael Stepner, “Early Withdrawal of Pandemic Unemployment Insurance: Effects on Employment and Earnings,” AEA Papers and Proceedings 112 (2022): 85–90.
[48] Iris Arbogast and Bill Dupor, “The Jobs Effect of Ending Pandemic Unemployment Benefits,” Federal Reserve Bank of St. Louis Working Paper 2022-010, February 2023. https://ssrn.com/abstract=4213346.
[49] Arbogast and Dupor, “The End of Emergency Pandemic Unemployment Benefits in 2021.”
[50] Whittaker and Isaacs, “Unemployment Insurance (UI) Benefits”; Ballotpedia, “State Government Plans to End Federal Unemployment Benefits Related to the Coronavirus (COVID-19) Pandemic, 2021.”
[51] Whittaker and Isaacs, “Unemployment Insurance (UI) Benefits.”
[52] Ballotpedia, “State Government Plans to End Federal Unemployment Benefits Related to the Coronavirus (COVID-19) Pandemic, 2021.”
[53] US Department of Labor, State Unemployment Insurance Trust Fund Solvency Report 2026. DOL reports that two states had outstanding Title XII advance balances totaling
$21.4 billion and one state had outstanding private borrowing instruments totaling an estimated $1.86 billion as of January 1, 2026.dition-August-2013.pdf
[54] The states with the outstanding Title XII advance balances are California and the US Virgin Islands (the latter is not included in this analysis). California an outstanding Title XII balance with $21,427,502,779 (99.9 percent of the total balance owed) while the US Virgin Islands had an outstanding balance of $19,879,008 for a total of $21,447,381,787. The state with the outstanding private borrowing was Massachusetts.
[55] US Department of Labor, Employment and Training Administration, “Unemployment Insurance Payment Accuracy by State.”
[56] US Government Accountability Office, GAO-23-106696: Unemployment Insurance: Estimated Amount of Fraud During Pandemic Likely Between $100 Billion and $135 Billion. September 12, 2023. https://www.gao.gov/products/gao-23-106696
[57] US Department of Labor, Employment and Training Administration, Estimated Employer Contribution Rates, Calendar Year 2025.
[58] Holzer, Hubbard, and Strain, “Did Pandemic Unemployment Benefits Reduce Employment?”
[59] Coombs et al., “Early Withdrawal of Pandemic Unemployment Insurance.”
[60] Arbogast and Dupor, “The Jobs Effect of Ending Pandemic Unemployment Benefits.”
[61] For reform-oriented discussions of unemployment insurance financing, work incentives, program integrity, and employer tax burdens, see Matt Darling, “Cre-ating a More Dynamic Unemployment Insurance System: The Case for Eliminating Experience Rating,” Niskanen Center, April 23, 2024; Chris Edwards and George C. Leef, “Failures of the Unemployment Insurance System,” Cato Institute, June 1, 2011; William Yeatman, “Unemployment Insurance Waste Is a Debacle Years in the Making,” Cato Institute, June 11, 2021; and Tax Foundation, “How the Federal Government and the States Could Help Save Small Businesses Through Temporary UI Tax Adjustments,” March 17, 2020.
[62] Eric Alston, Amber Case, and Michael Zargham, “Path Dependence: An Uncomfortable Institutional Design Axiom,” conference paper, Digital Library of the Commons, Indiana University, 2024, https://hdl.handle.net/10535/11015.
[63] Veronique de Rugy, “A Better Form of Unemployment Protection,” Regulation, Spring 2021, https://www.cato.org/regulation/spring-2021/better-form-unem-ployment-protection.
[64] Veronique de Rugy, “A Timely Redux for Personal Unemployment Insurance Savings Accounts,” Mercatus Special Edition Policy Brief, April 3, 2020, https://ssrn.com/abstract=3592936.
[65] de Rugy, “Timely Redux.”
[66] de Rugy, “Better Form of Unemployment Protection.”
[67] de Rugy, “A Timely Redux.”
[68] Kirsten Sehnbruch, Rafael Carranza, and Dante Contreras, “Designing Unemployment Insurance Systems in Developing Countries: Moral Hazard vs. Liquidity Constraints in Chile,” May 21, 2020, https://ssrn.com/abstract=3607058.
[69] Sehnbruch, Carranza, and Contreras, “Designing Unemployment Insurance Systems.”
[70] William McBride, Huaqun Li, Garrett Watson, and Alex Durante, “Simplifying Saving and Improving Financial Security through Universal Savings Accounts,” Tax Foundation, May 29, 2024, https://taxfoundation.org/research/all/federal/ universal-savings-accounts-financial-security/.
[71] In addition to the 11 savings vehicles mentioned in McBride et al., the federal tax code will also offer Trump Accounts for children as well as Trump IRAs. This point is offered only as an illustration of the broader complexity of the federal savings system, not as a separate empirical claim.
[72] Thomas Savidge, “The Work vs. Welfare Trade Off Revisited,” AIER, February 19, 2025, https://aier.org/article/the-work-vs-welfare-tradeoff-revisited/.
[73] Adam Michel, “Universal Savings Accounts to Help Families Build Wealth,” Cato Institute, May 22, 2024, https://www.cato.org/blog/universal-savings-accounts-help-families-build-wealth.
[74] Michel, “Universal Savings Accounts.”
[75] McBride et al., “Simplifying Saving.”
[76] McBride et al., “Simplifying Saving.”
[77] US Department of Labor, Solvency Report 2026.
[78] US Government Accountability Office, “Fraud and Improper Payments,” accessed April 27, 2026, https://www.gao.gov/fraud-improper-payments.
[79] US Department of Labor, Solvency Report 2021.
[80] US Department of Labor, Solvency Report 2021.
[81] US Department of Labor, Solvency Report 2021.
[82] US Department of Labor, Solvency Report 2021.
[83] US Department of Labor, Solvency Report 2021.
[84] US Department of Labor, Solvency Report 2021.
“