


Workday stock price continues its strong freefall this year, and is now hovering at its lowest level since April 2020. It has slumped in the last four consecutive months, and is down by 61.95% from its all-time high.
Workday stock has become a bargain amid the SaaSpocalypse concerns
The WDAY stock price has been in a strong freefall in the past few months amid the ongoing SaaSpocalypse concerns. Analysts and investors believe that SaaS companies will be in trouble as new AI tools come up.
The sell-off has made it a highly undervalued company using most metrics. For example, the forward non-GAAP price-to-earnings ratio has slumped to 12, which is much lower than the sector median of 21. Its five-year average is 44, meaning that it is trading with a 72% discount.
The same is true in terms of the forward enterprise value to EBITDA multiple of 8.83, which is also lower than the sector median of 12.8. These numbers mean that the company has never been this cheap in years.
To a large extent, these valuations cannot be justified as the company’s business is still doing well and its services are not easily replaceable with AI. For one, its application domains are really hard to build. In the last earnings statement, the founder and CEO said:
“These are true systems of record that must process transactions with absolute accuracy and speed, enforce complex security models, and comply with statutory and regulatory requirements all over the world.”
The results showed that its revenue jumped by 14.5% in the fourth quarter to over $2.52 billion, while its operating margin rose to 6.9%. Also, the free cash flow jumped by 18.8% to $1.21 billion.
For the year, the company’s revenue rose 13.1% to $9.52 billion, while its free cash flow rose by 26.7% to $2.77 billion.
Most notably, analysts believe that the company’s double-digit growth trend will continue. The average estimate is that its annual revenue will jump by 11% this year to $10.6 billion, followed by another 11% to $11.6 billion.
At the same time, the management is taking advantage of the cheap stock price to buy more shares. They spent $1.5 billion in repurchases in the fourth quarter and $2.9 billion for the full year. These repurchases will likely continue in the future, which will boost its earnings per share.
Workday stock price technical analysis
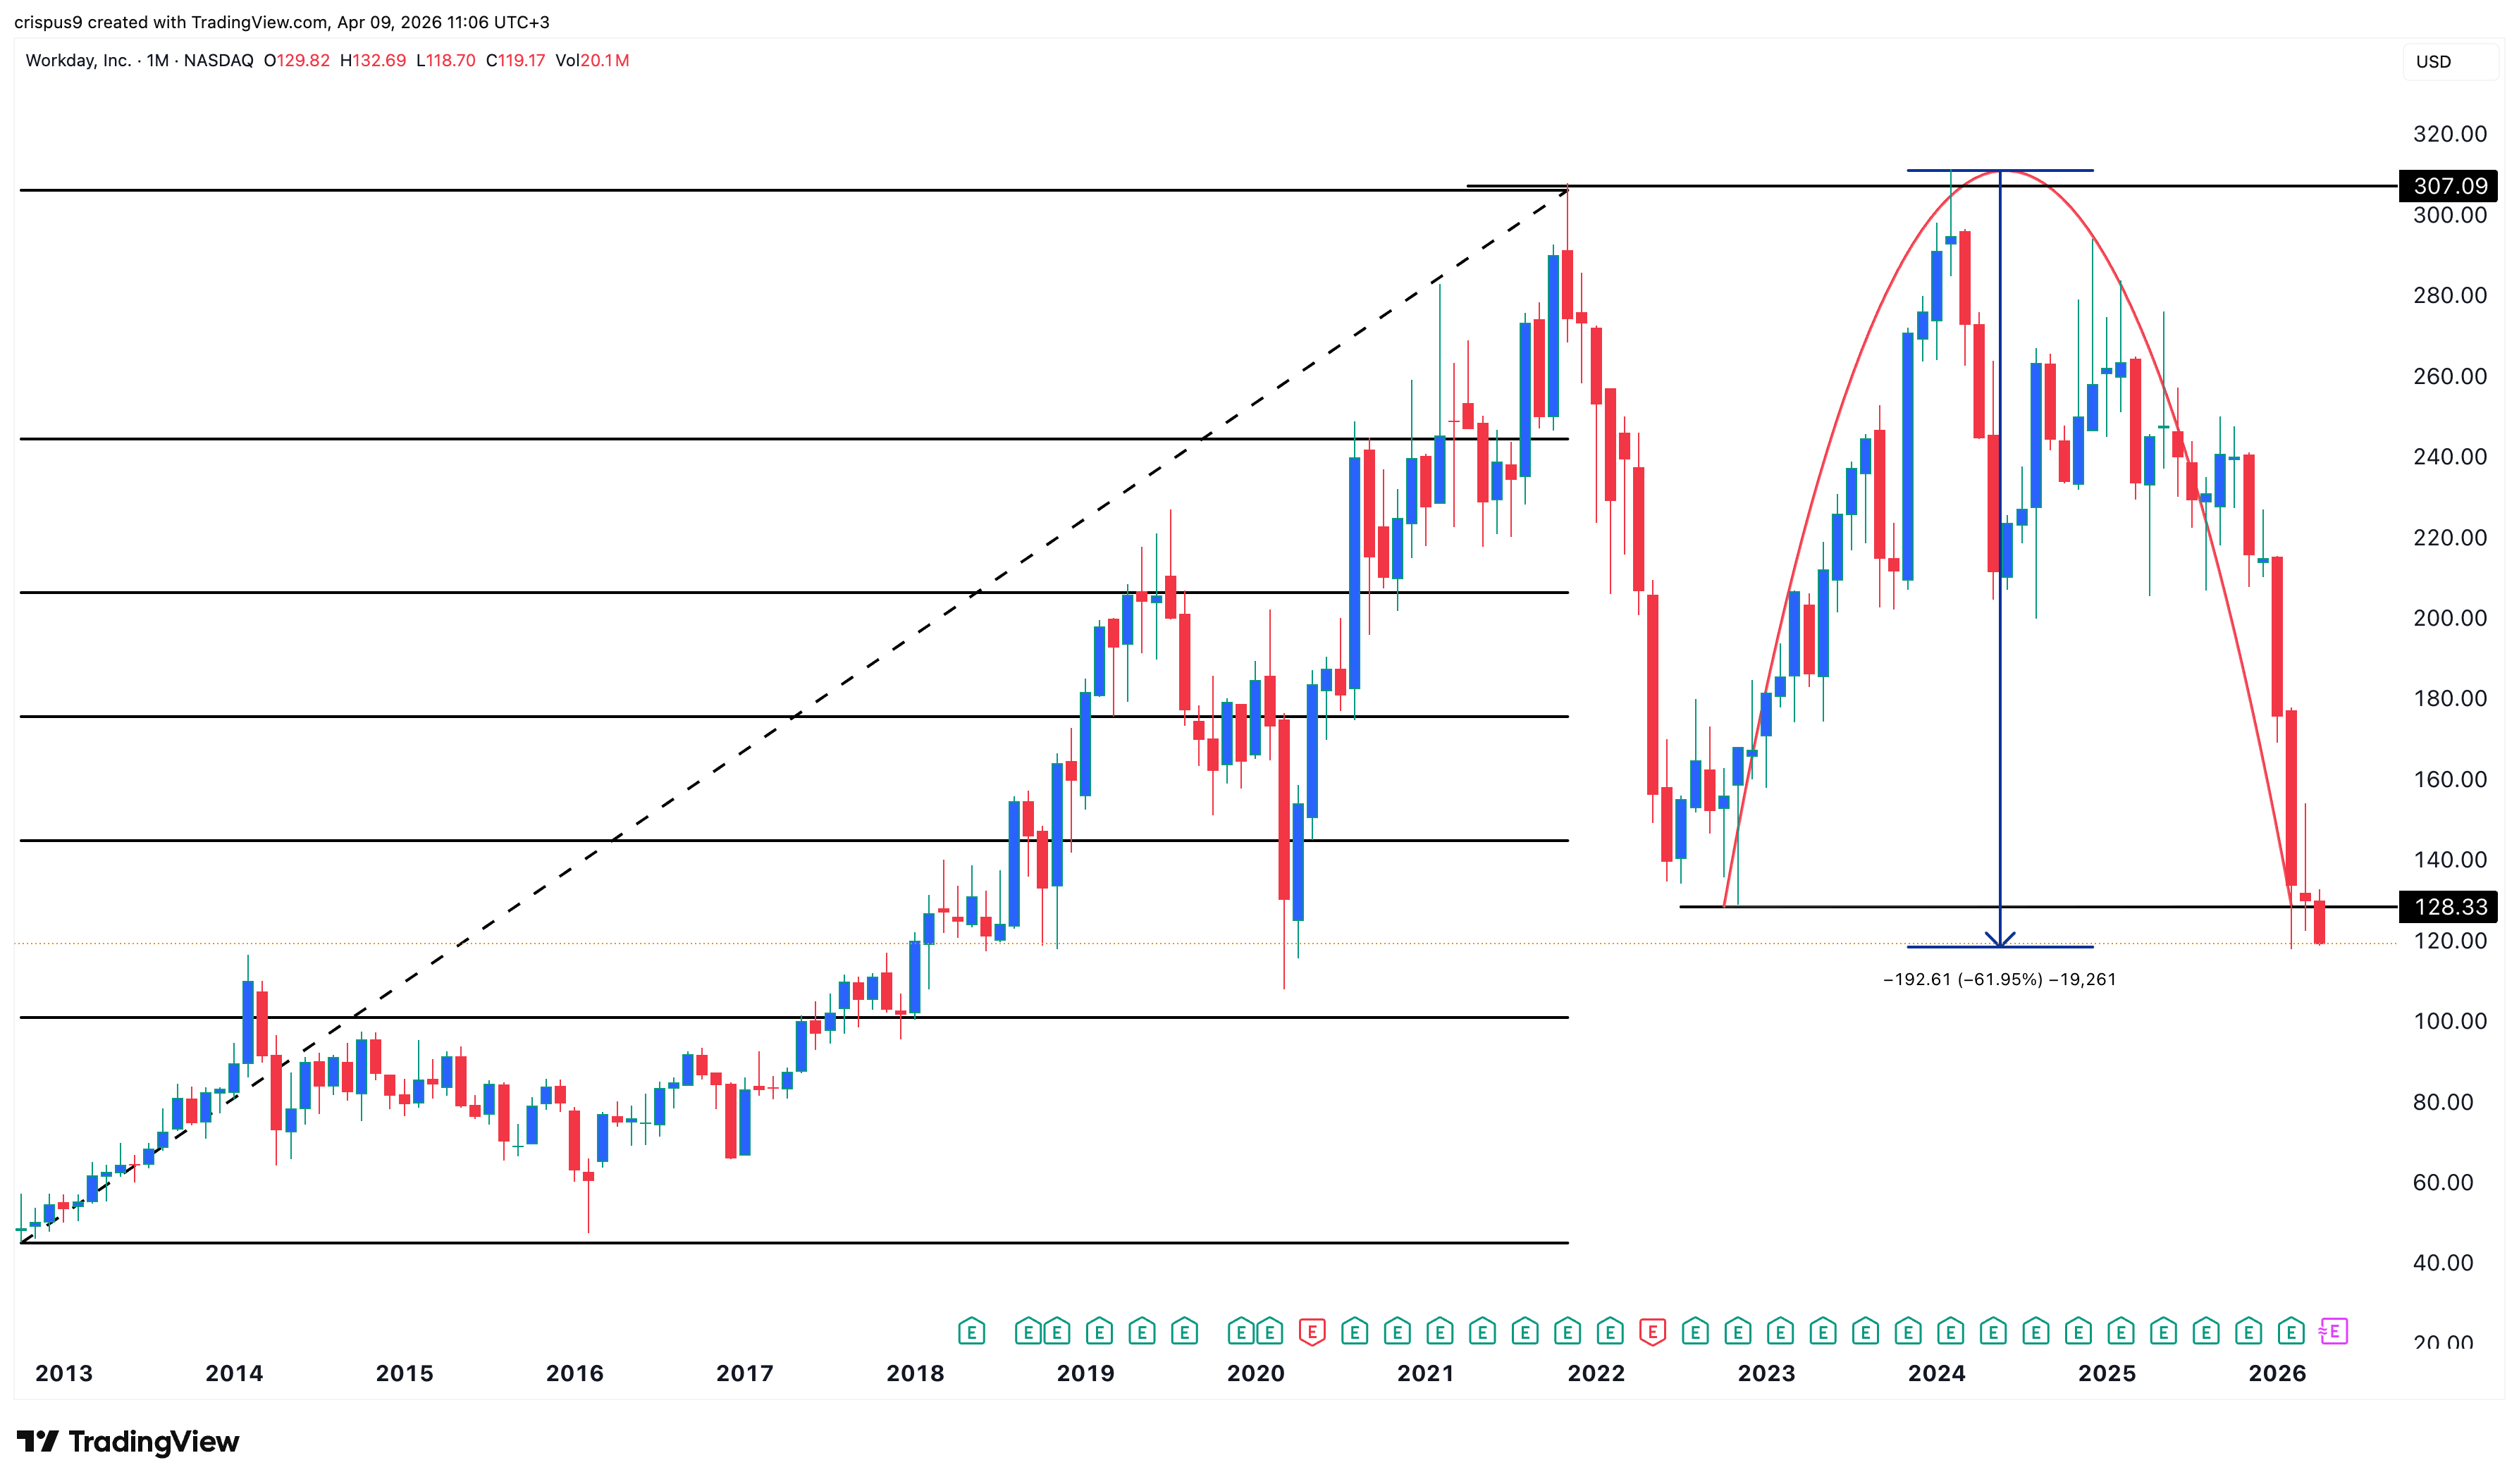
WDAY stock chart | Source: TradingView
While Workday stock is a bargain, technicals suggest that it will continue falling in the near term. The monthly chart shows that it formed a giant double-top pattern, a common bearish reversal sign in technical analysis. It has now moved below slightly below the neckline at $128.33, confirming the bearish outlook
The stock has also formed an inverted cup-and-handle pattern, which is a common bearish continuation sign in technical analysis.
Therefore, the most likely forecast is bearish, with the next important target being at the psychological level at $100, which coincides with the 78.6% Fibonacci Retracement level.
The post Workday stock sell-off is irrational, but monthly chart points to a steeper crash appeared first on Invezz